Downtime operations
This section describes how to add/edit/delete downtime.
A downtime contains the following information: a schedule start time and a schedule end time.
Downtimes can be triggered to start or stop immediately.
Downtimes are organized using tags from the monitors.
Downtime types
Two schedule types are available (the Type selector in the downtime form):
- Custom — a one-off maintenance window defined by a start and an end date/time (a date-time range picker). Once the end time is reached the downtime is
done. - Regular — a recurring weekly window. Pick one or more start days of the week plus a start time, and one or more end days of the week plus an end time. The webserver turns this into internal cron schedules and re-triggers the downtime every week until you disable or delete it. Typical use: “every Saturday 22:00 to Sunday 06:00” for a weekly batch or backup window.
The type of an existing downtime cannot be changed while it is running.
Downtime scope: monitors, tags and applications
A downtime can target, in any combination:
- explicit monitors of every type (browser scripts, URL, API, TCP, UDP, ping, nslookup, DB, SNMP devices, WMI devices, system/hosts),
- tags per monitor type — every monitor of that type carrying the tag is included,
- applications — all monitors that belong to the selected app(s) are included, child (nested) apps are expanded recursively.
While the downtime is active, the affected monitors are not scheduled to run and their status is frozen; when it ends, their pre-downtime status is restored.
Impact preview
Before saving, the downtime form shows an impact preview: the current scope (monitors + tags + apps) is resolved server-side — without saving anything — and the resulting list of affected monitors and applications is displayed, grouped by monitor type, with the probe each monitor runs on. Use it to verify a tag does not pull in more monitors than intended.
Downtimes are organized by tags
The computed list of monitors
Downtimes can be associated with tag(s) and/or monitor(s). The list of monitors they reference is generated from the tag(s) and/or monitor(s).
For instance: mon1 has tag1, mon2 has tag1 , mon3 has tag2, mon4 has no tag. A given report has monitor mon4 and has tag tag1, then the computed list of monitors for this report will be mon1, mon2, mon4. The downtime will be triggered for each monitor in this list.
Accessing downtimes and user privileges
Users in the ADMIN group can add, edit, or delete a downtime, as well as add or remove monitor(s) and/or tag(s) from a downtime.
UUsers with tags matching those on the downtime and belonging to the USER group can also add, edit, or delete a downtime, as well as add or remove monitor(s) and/or tag(s) from a downtime
A downtime can have one or more tags.
Add a Downtime
- Click on the plus icon

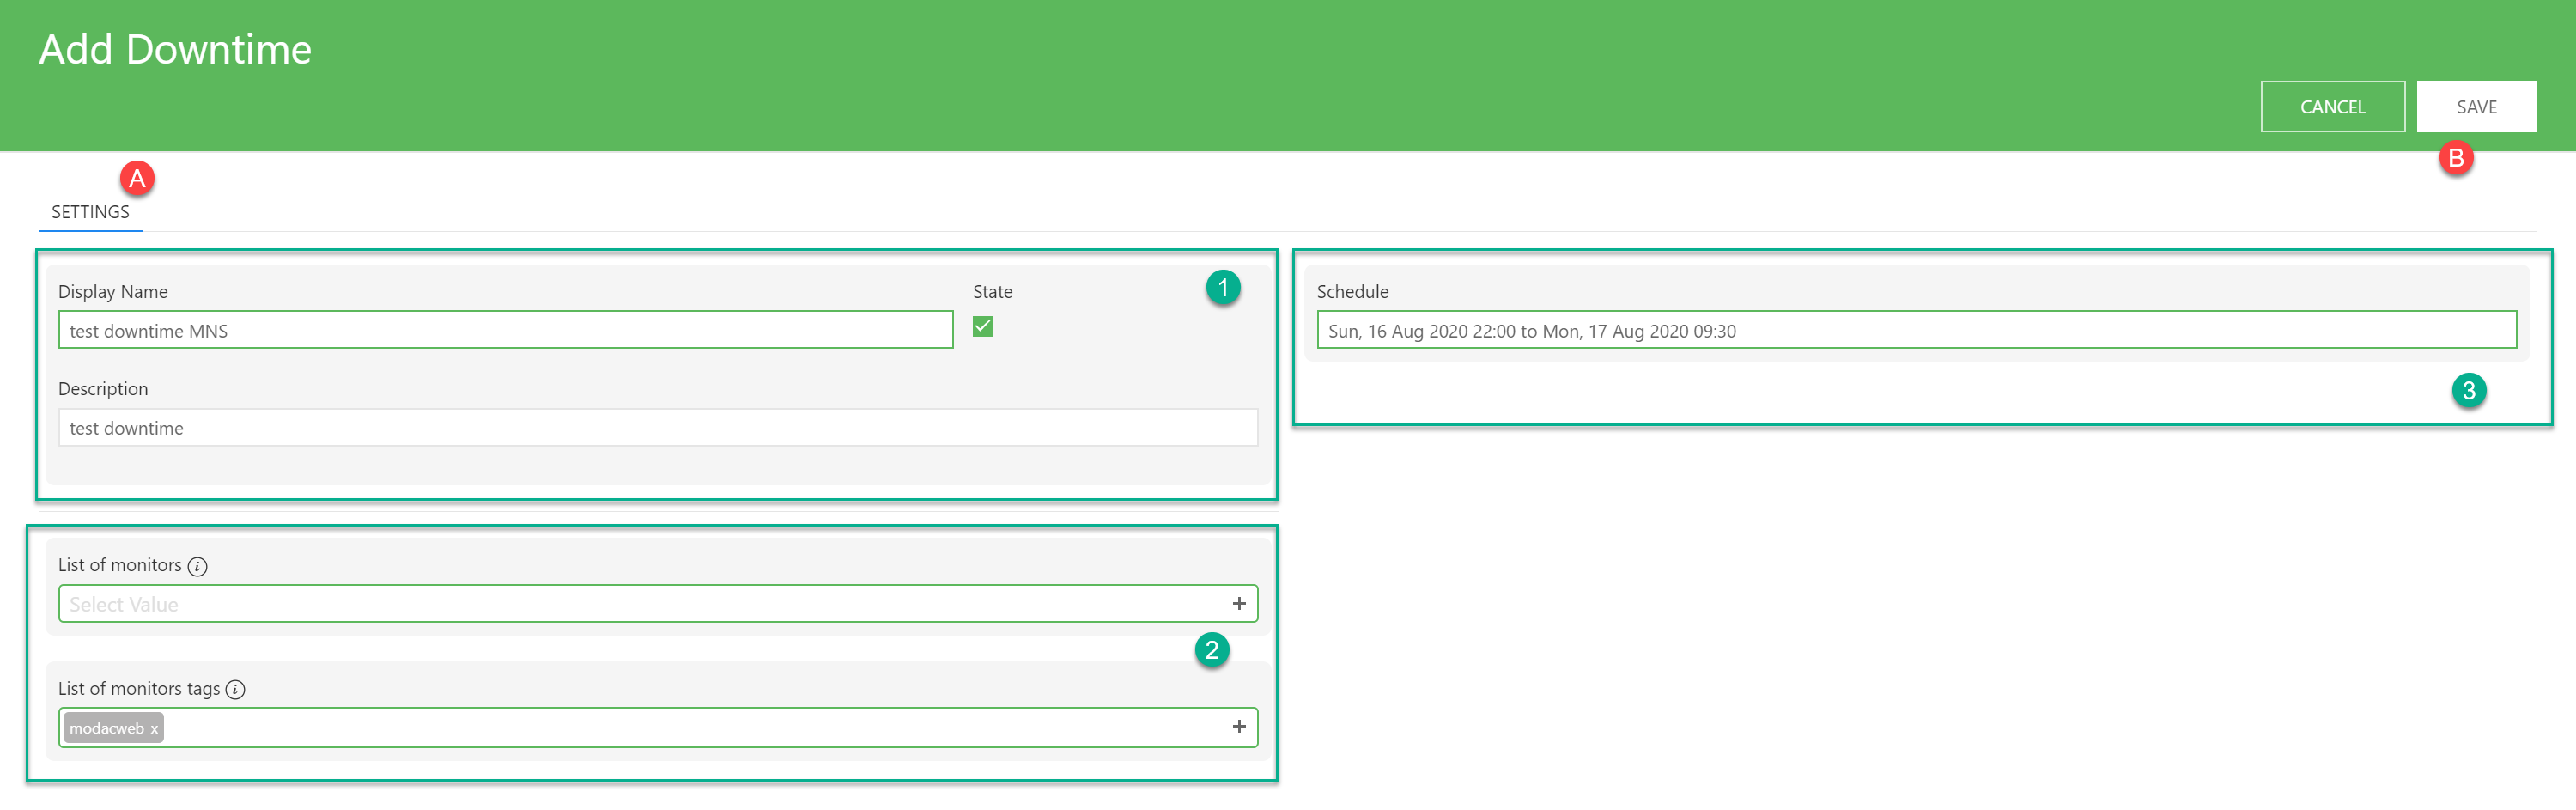
A. Go to the Settings panel
- Set the downtimename, state (enabled/disabled), optionnally a description.
- Add monitors and/or tags fields for this downtime.
- Add recipients emails, the Data Range over which the data should be collected, enter the scheduled date time.
B. Click on save
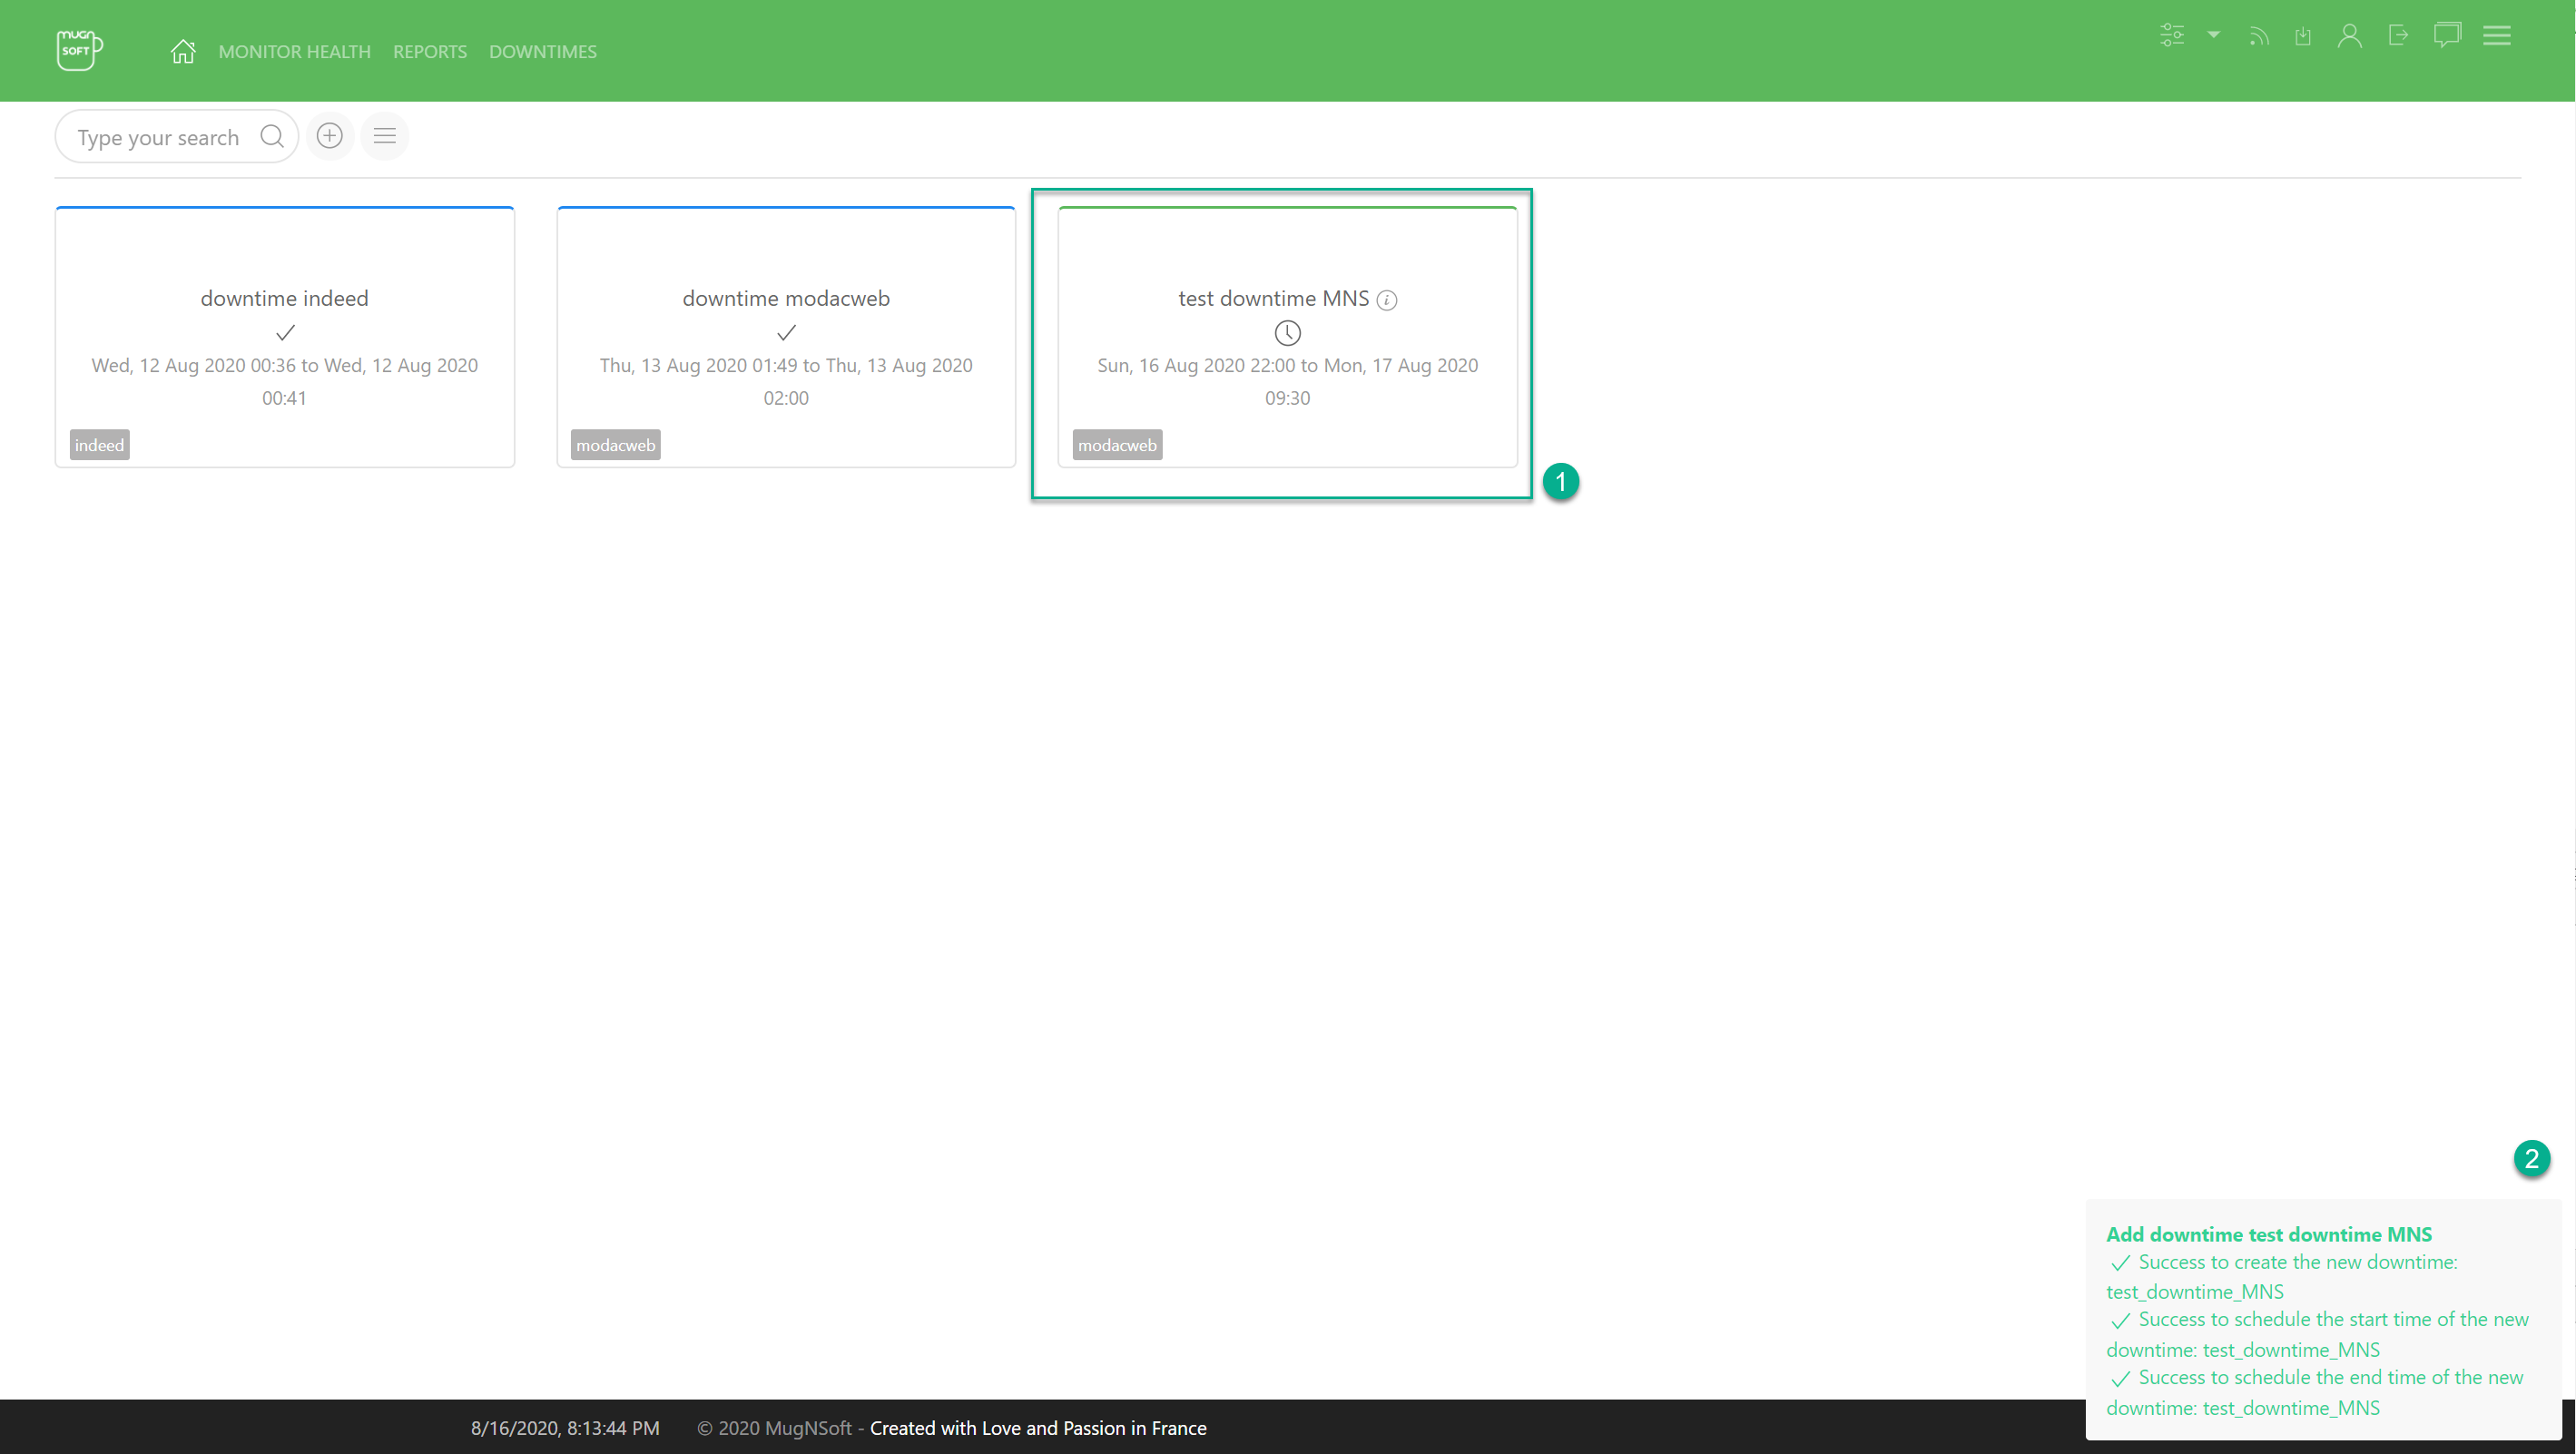
- The new downtime appears in the list
- A notification window box will appear at the right corner
Edit a Downtime
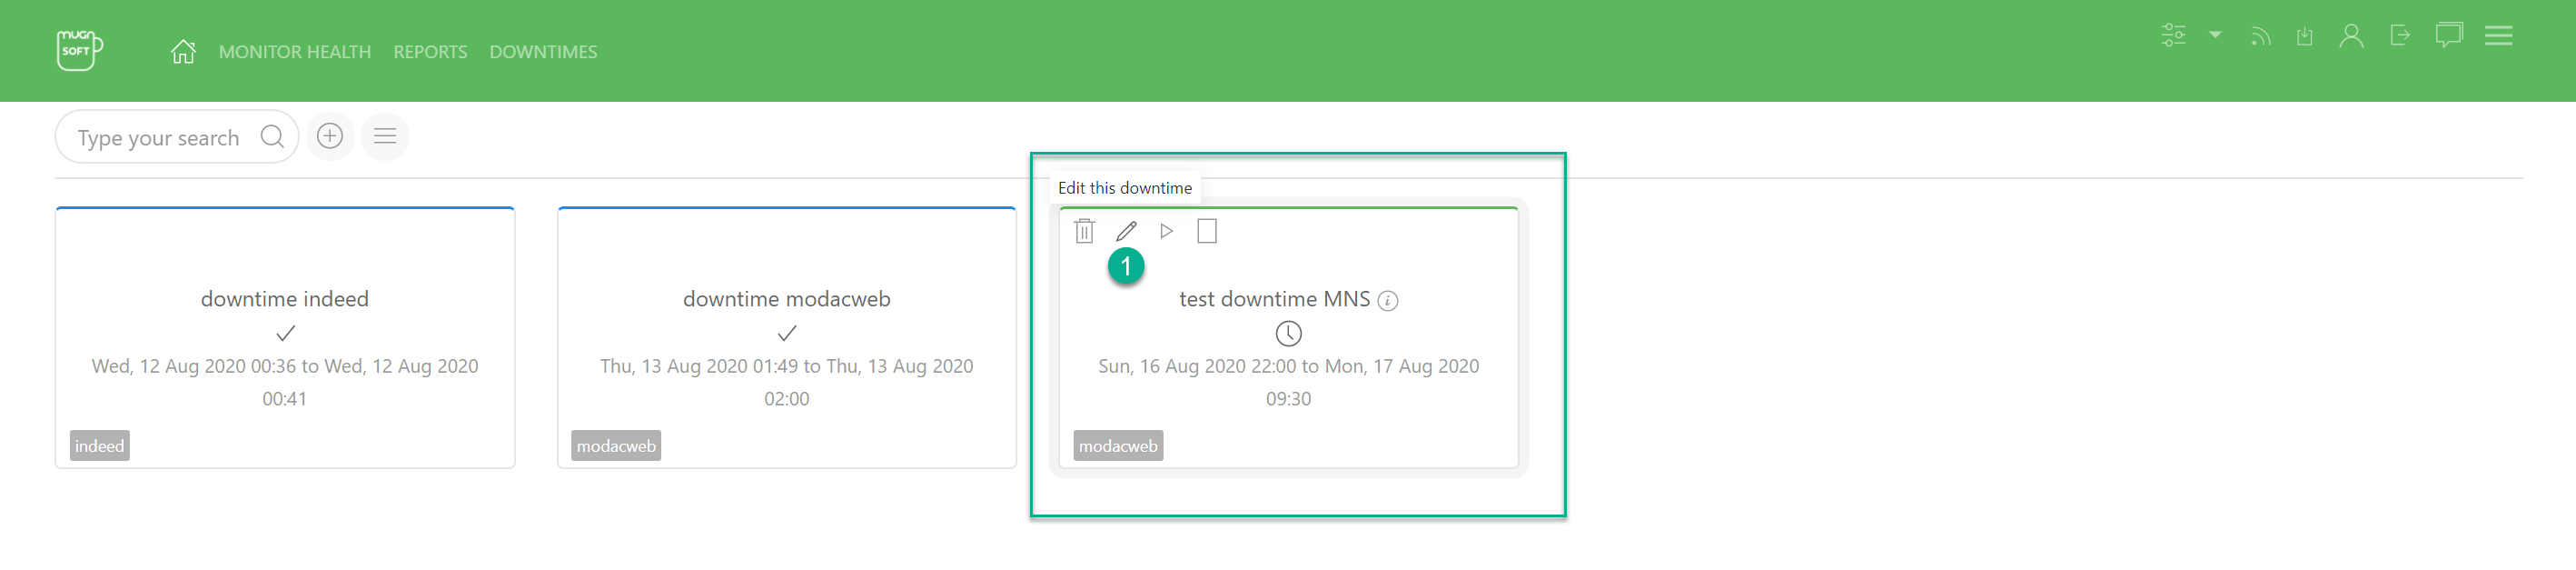
- Click on the pencil icon
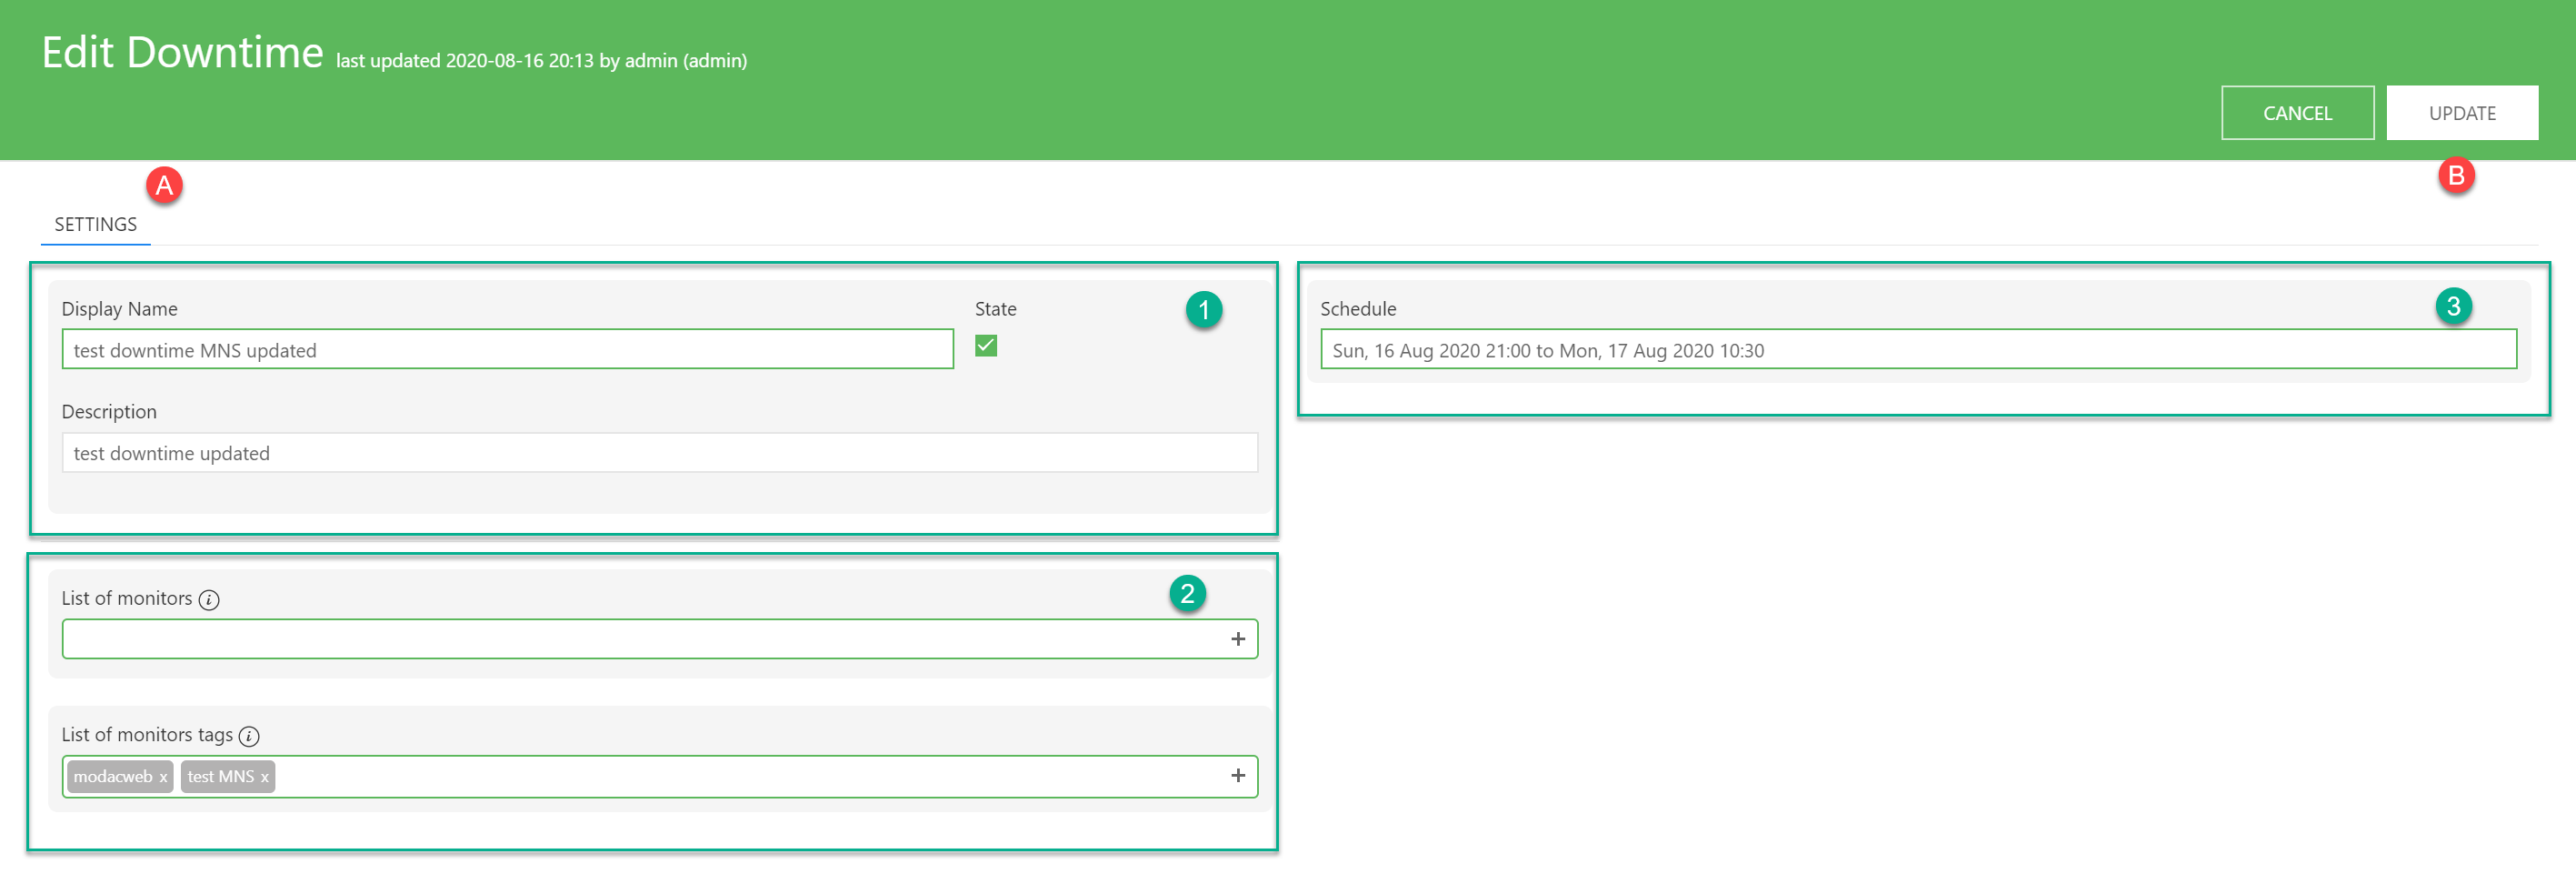
A. Go to the Settings panel
- Edit the downtimename, state (enabled/disabled), description.
- Edit monitors and/or tags fields for this downtime.
- Edit recipients emails, the Data Range over which the data should be collected, edit the scheduled date time.
B. Click on update
- The new tag should be visible in the downtime list.
- A notification window box will appear at the right corner
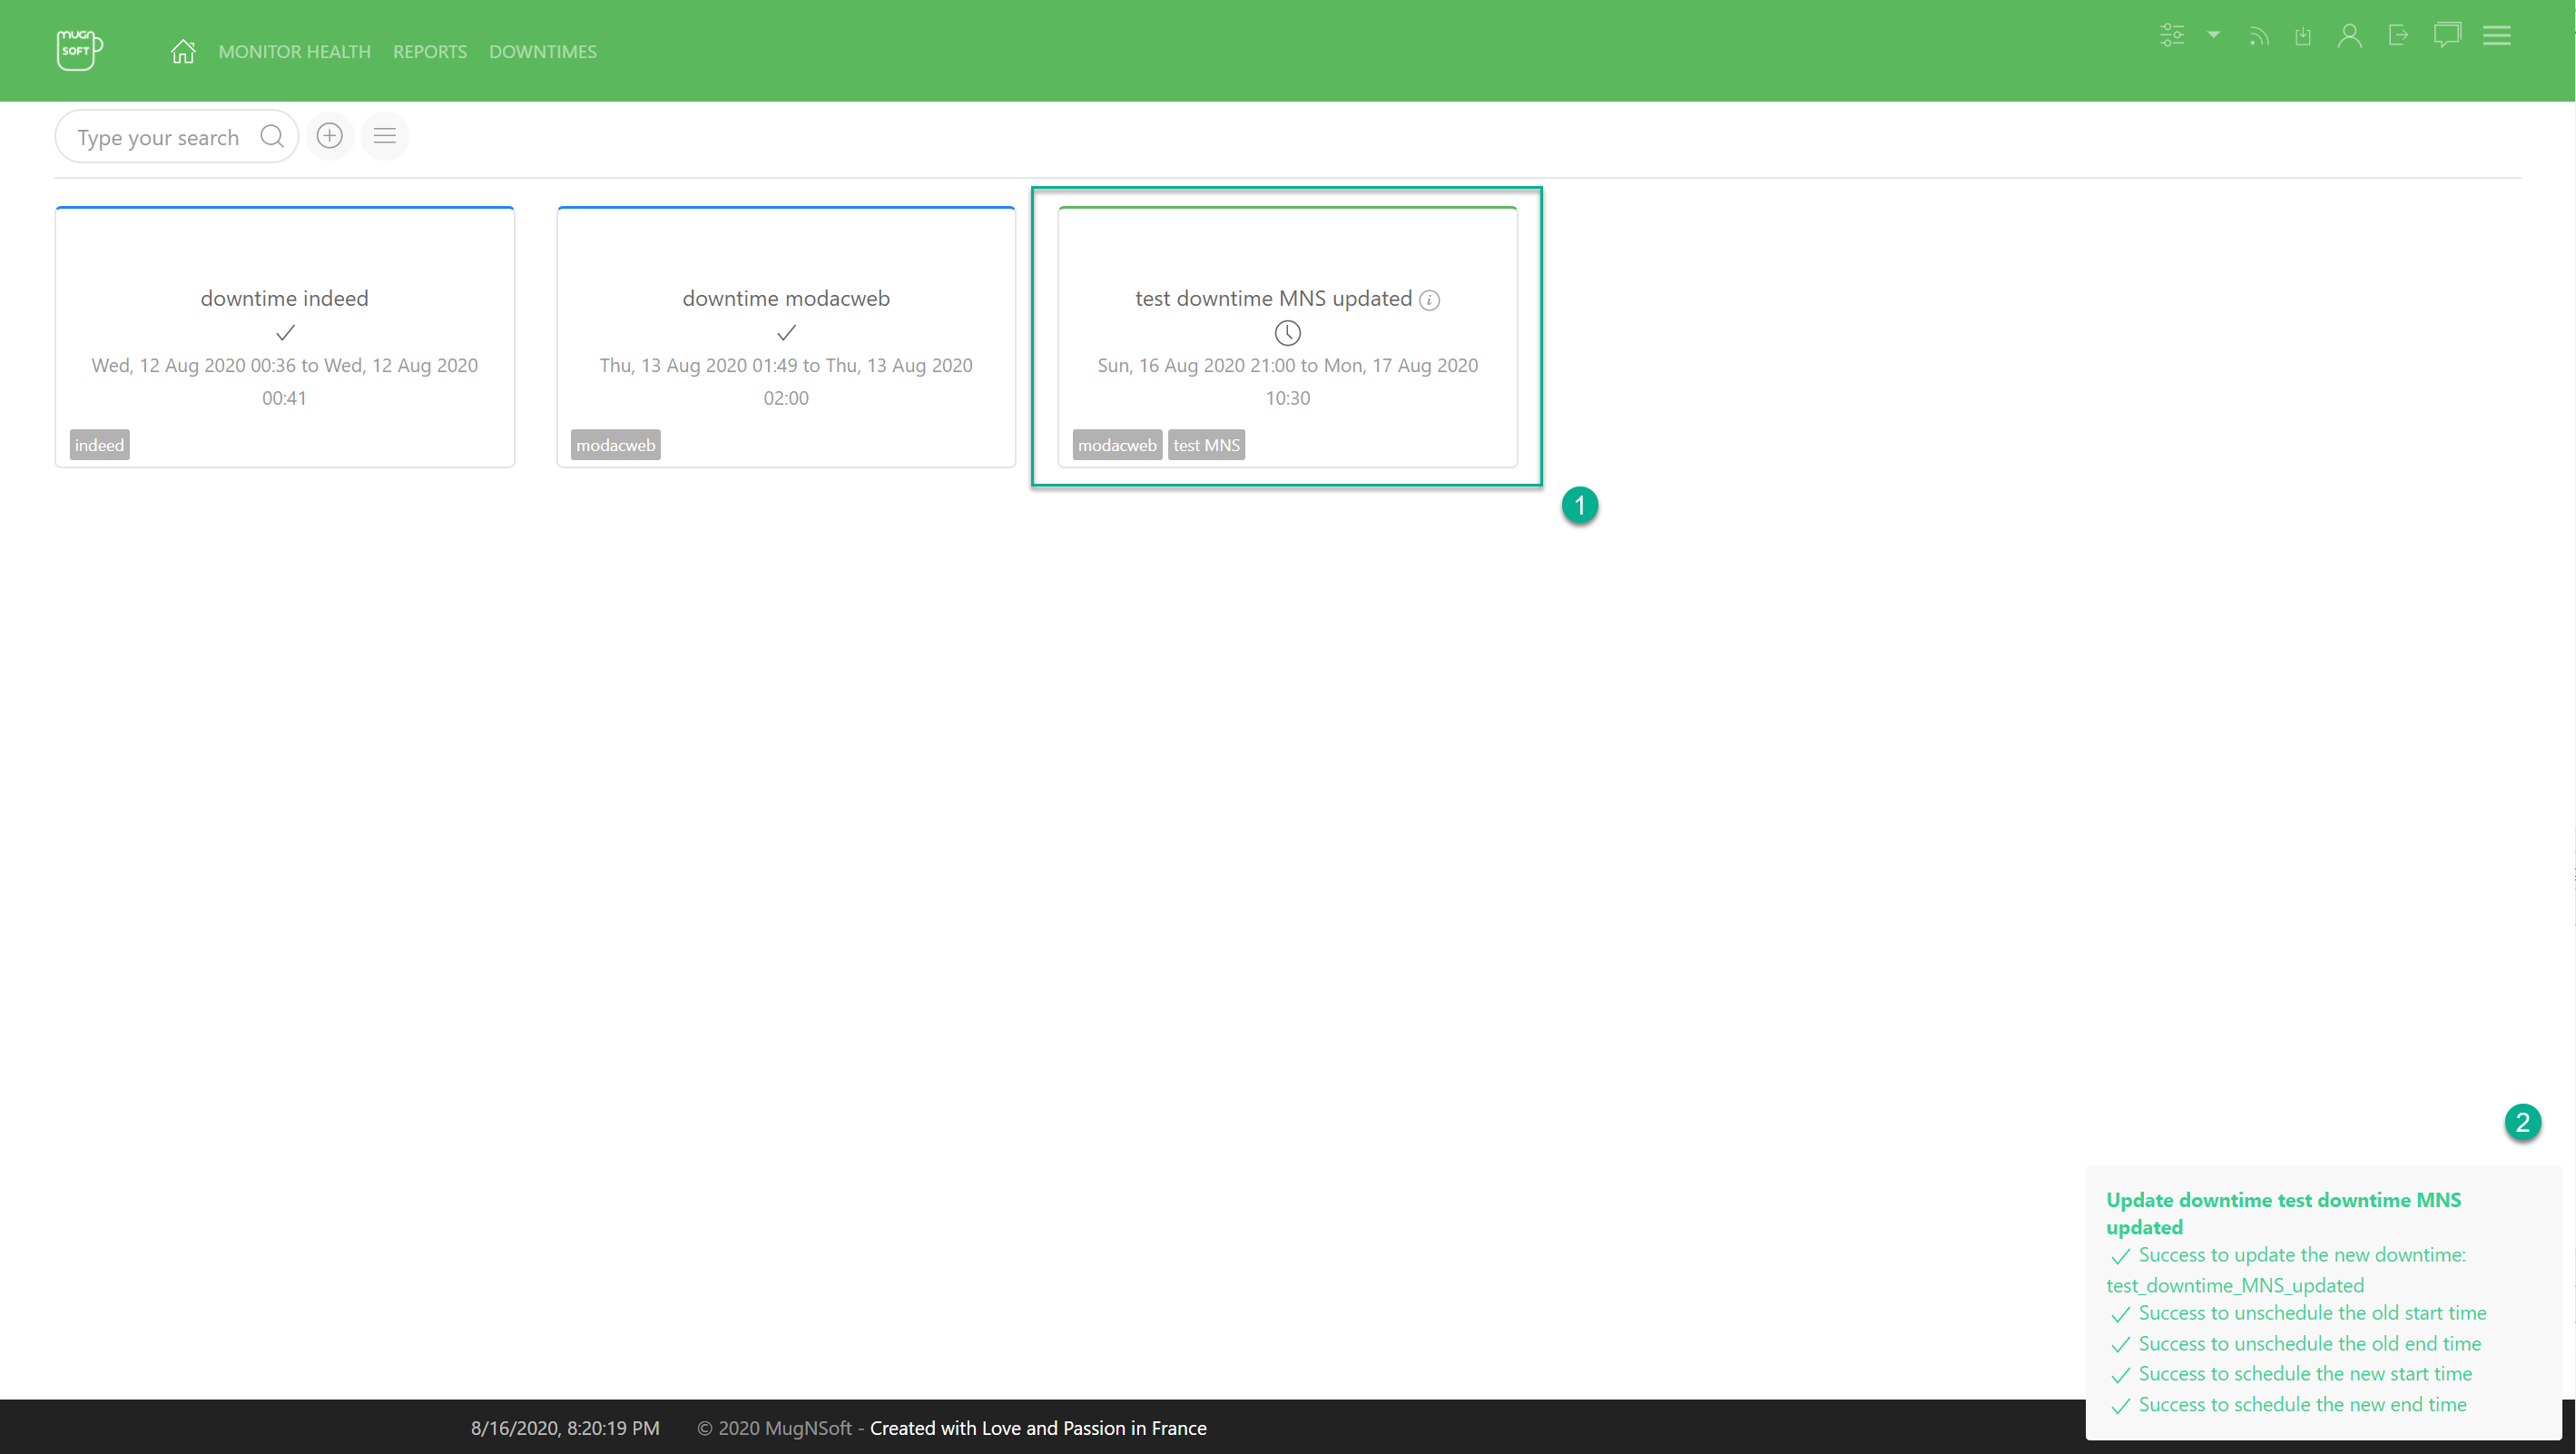
In the below screenshot, we can see:

- A completed downtime
- A scheduled downtime
- A running downtime
Start a Downtime immediately
- click on the forced start icon (1)
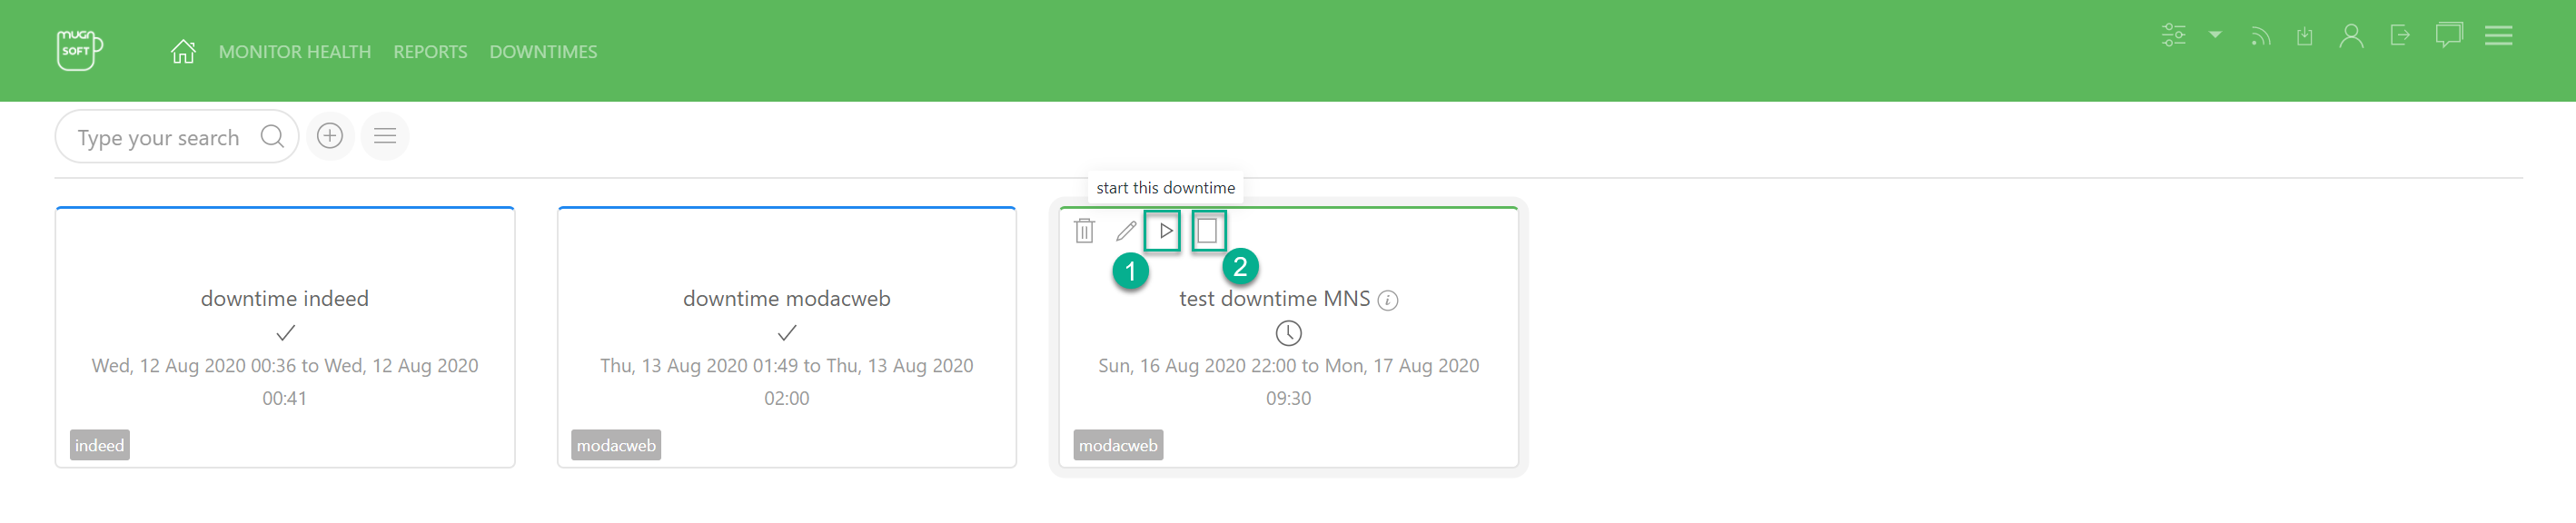
- The downtime state should have changed.
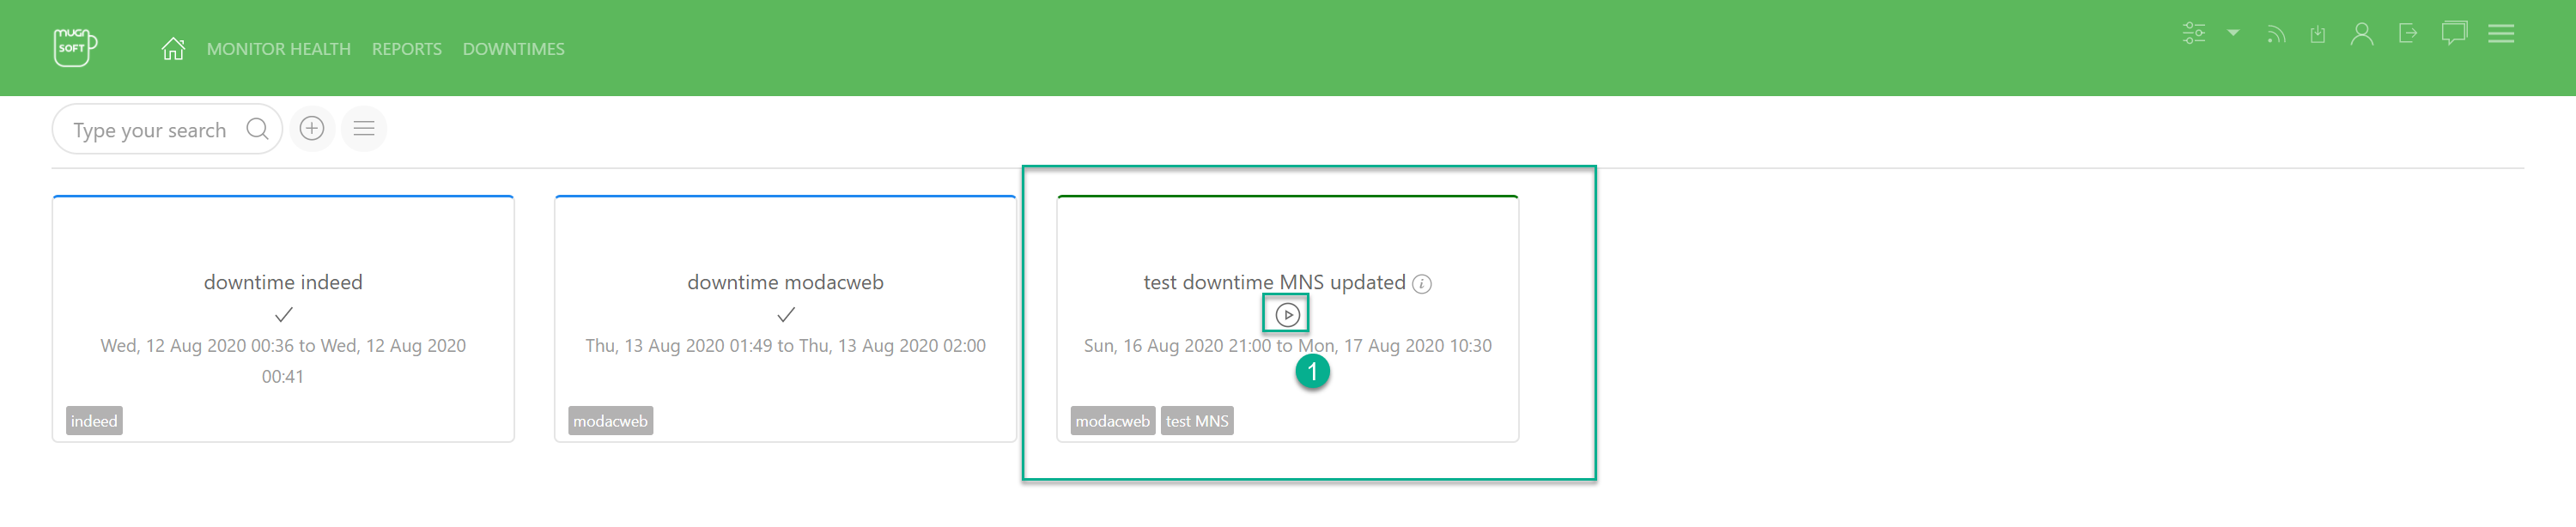
There’s a notification box saying that the downtime was triggered

- The monitors related to this downtime should be in downtime. From now they should not be scheduled to run.
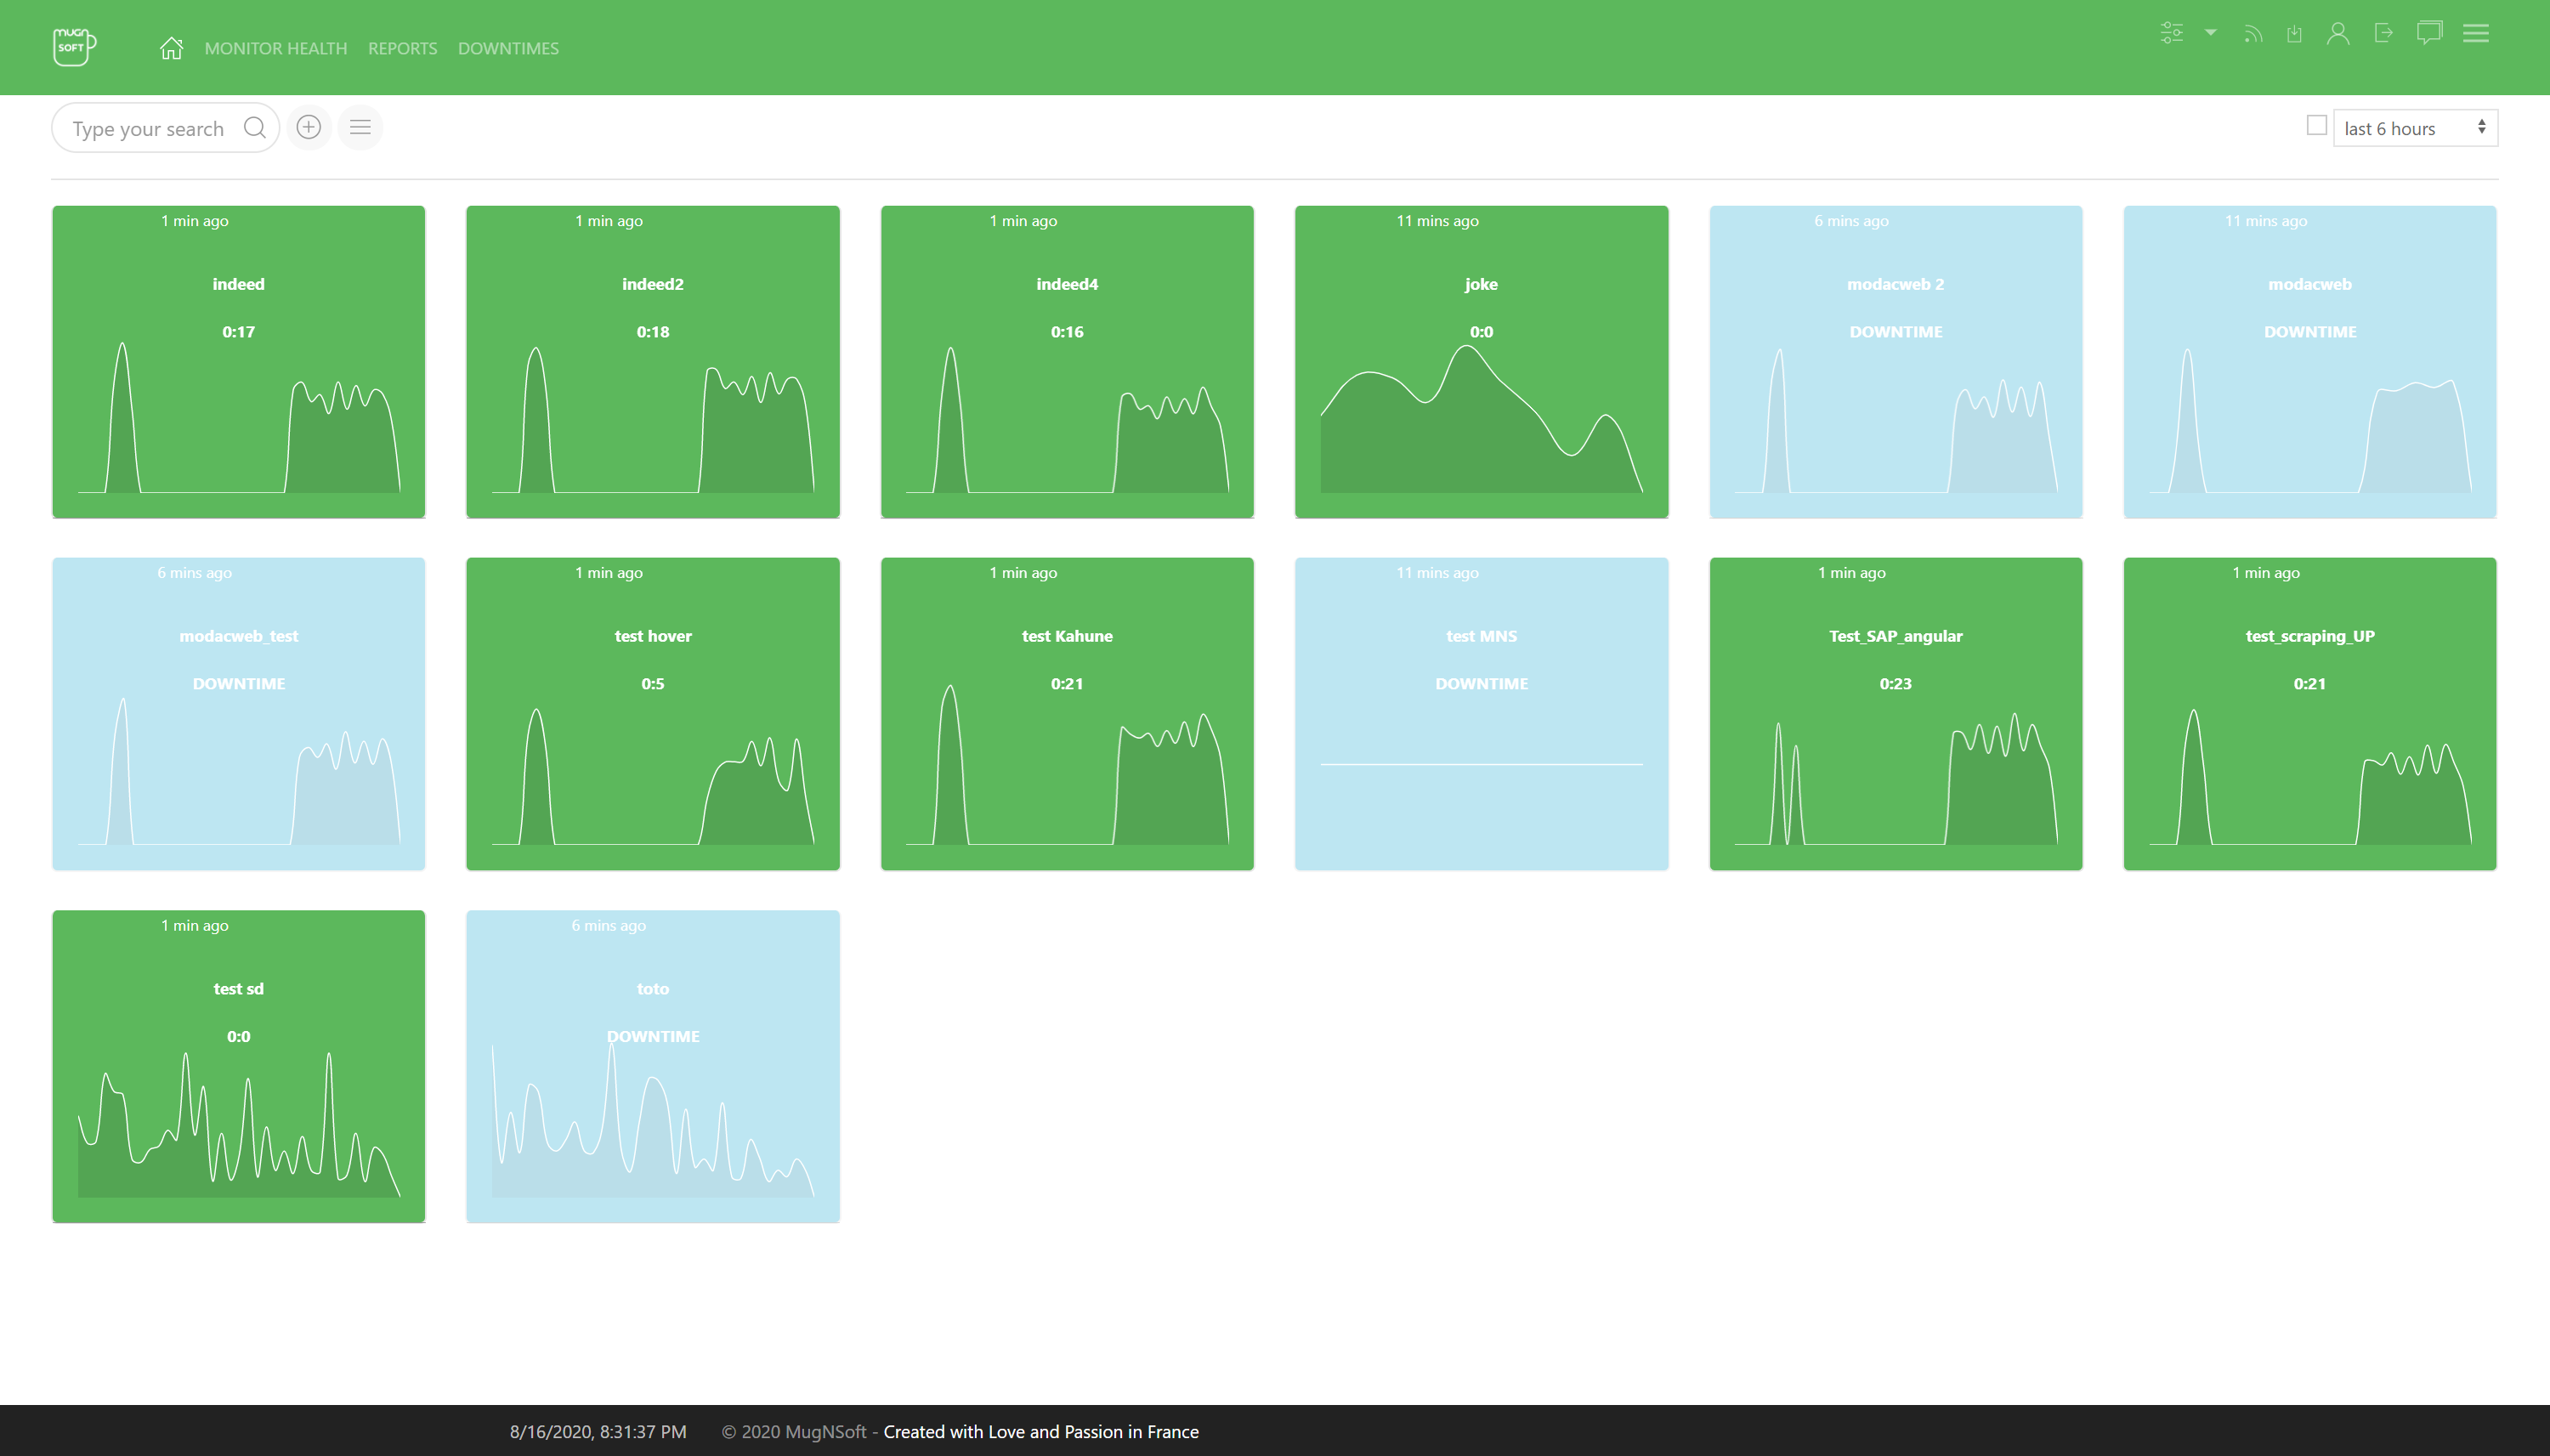
Stop a Downtime immediately
- click on the forced stop icon (2)
- Enter the recipient email address
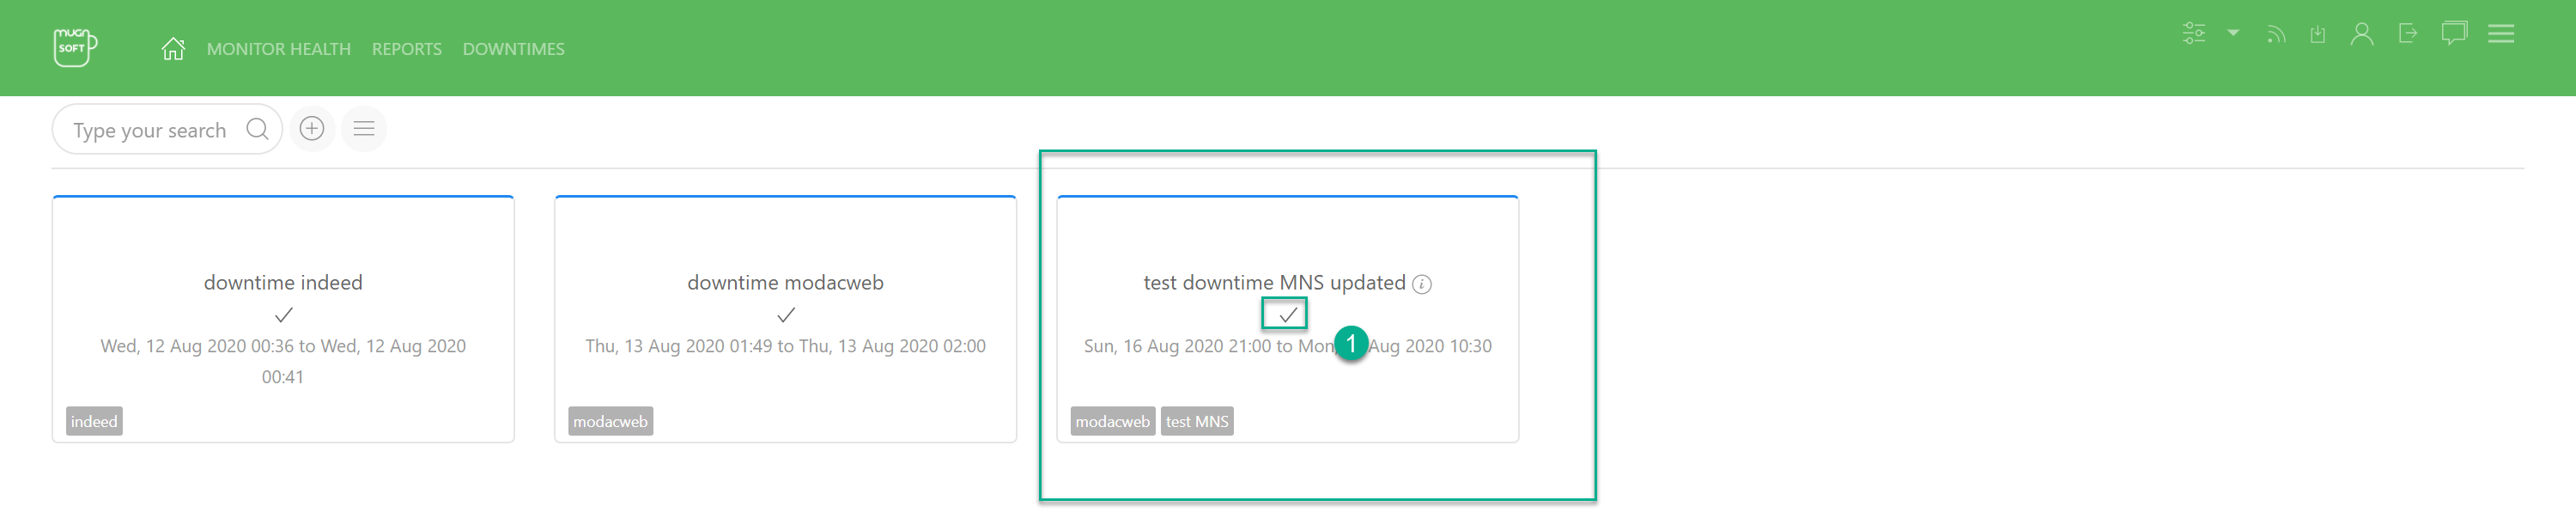
There’s a notification box saying that the downtime was triggered
Delete a Downtime
- Click on the trash icon

- Confirm the deletion

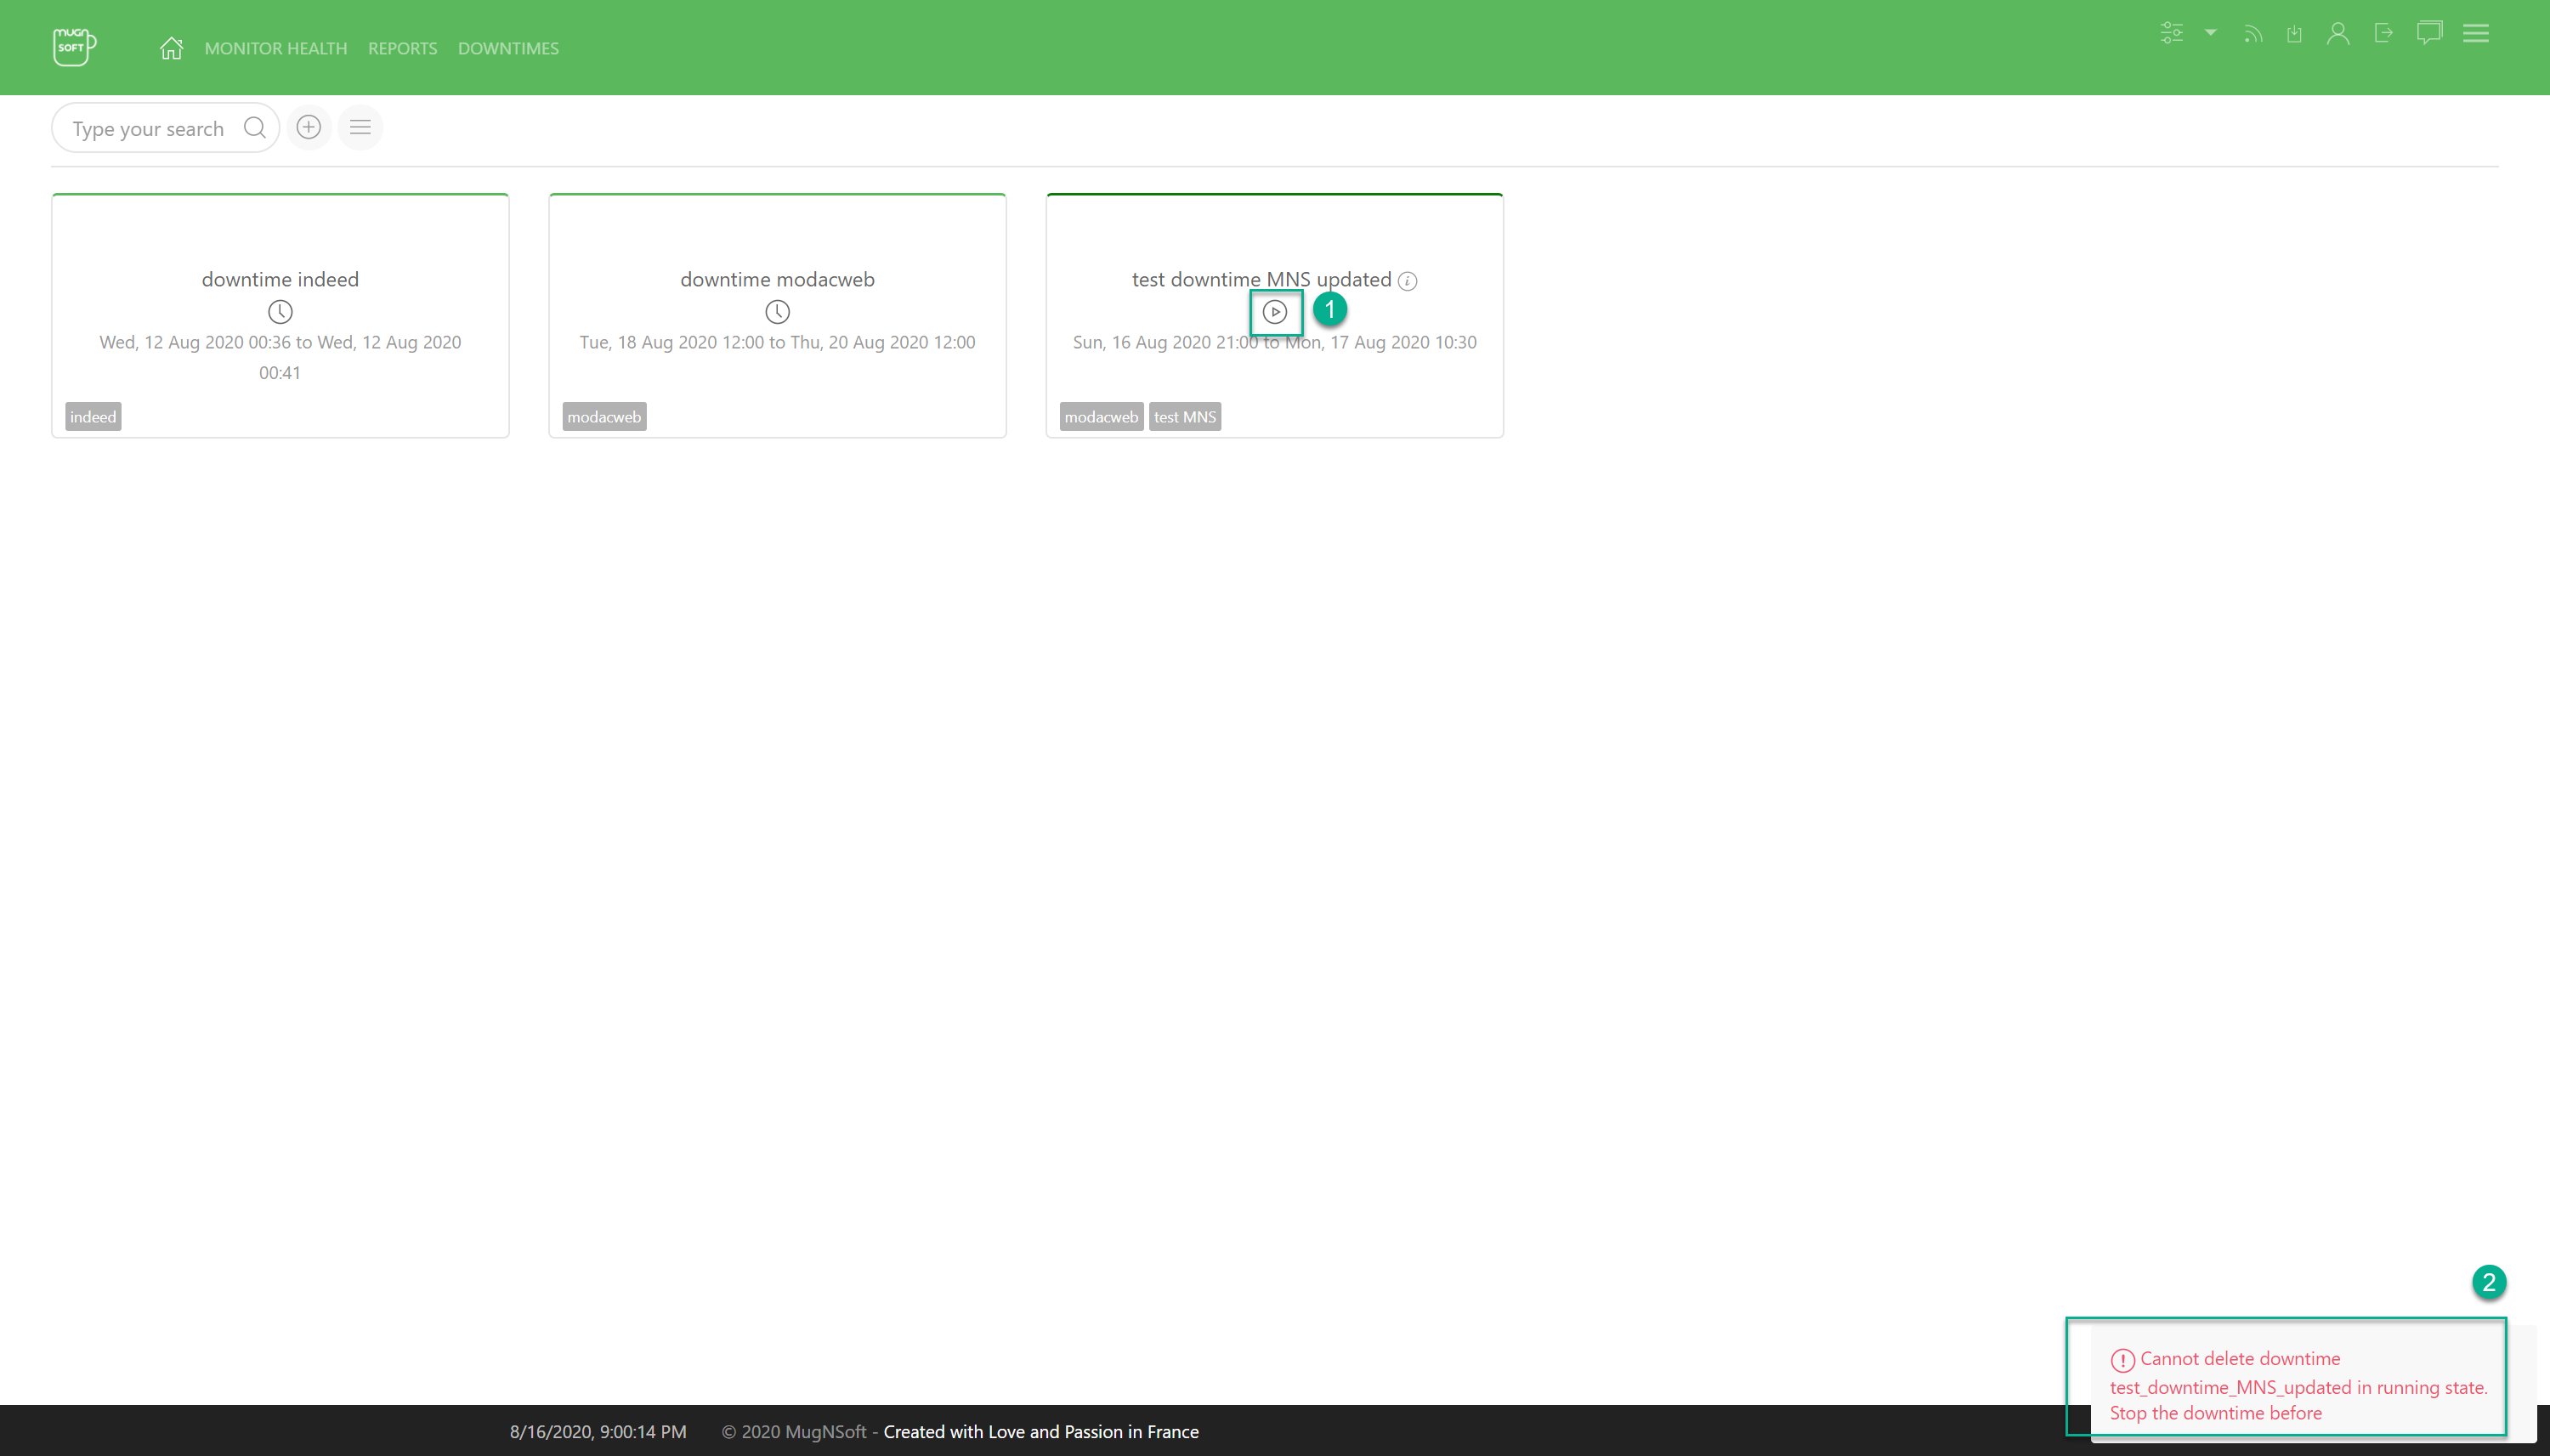
- The downtime is currently running (by design we cannot delete a running downtime)
- That deletion was prevented as this donwtime is still running. A status is displayed in the notification box
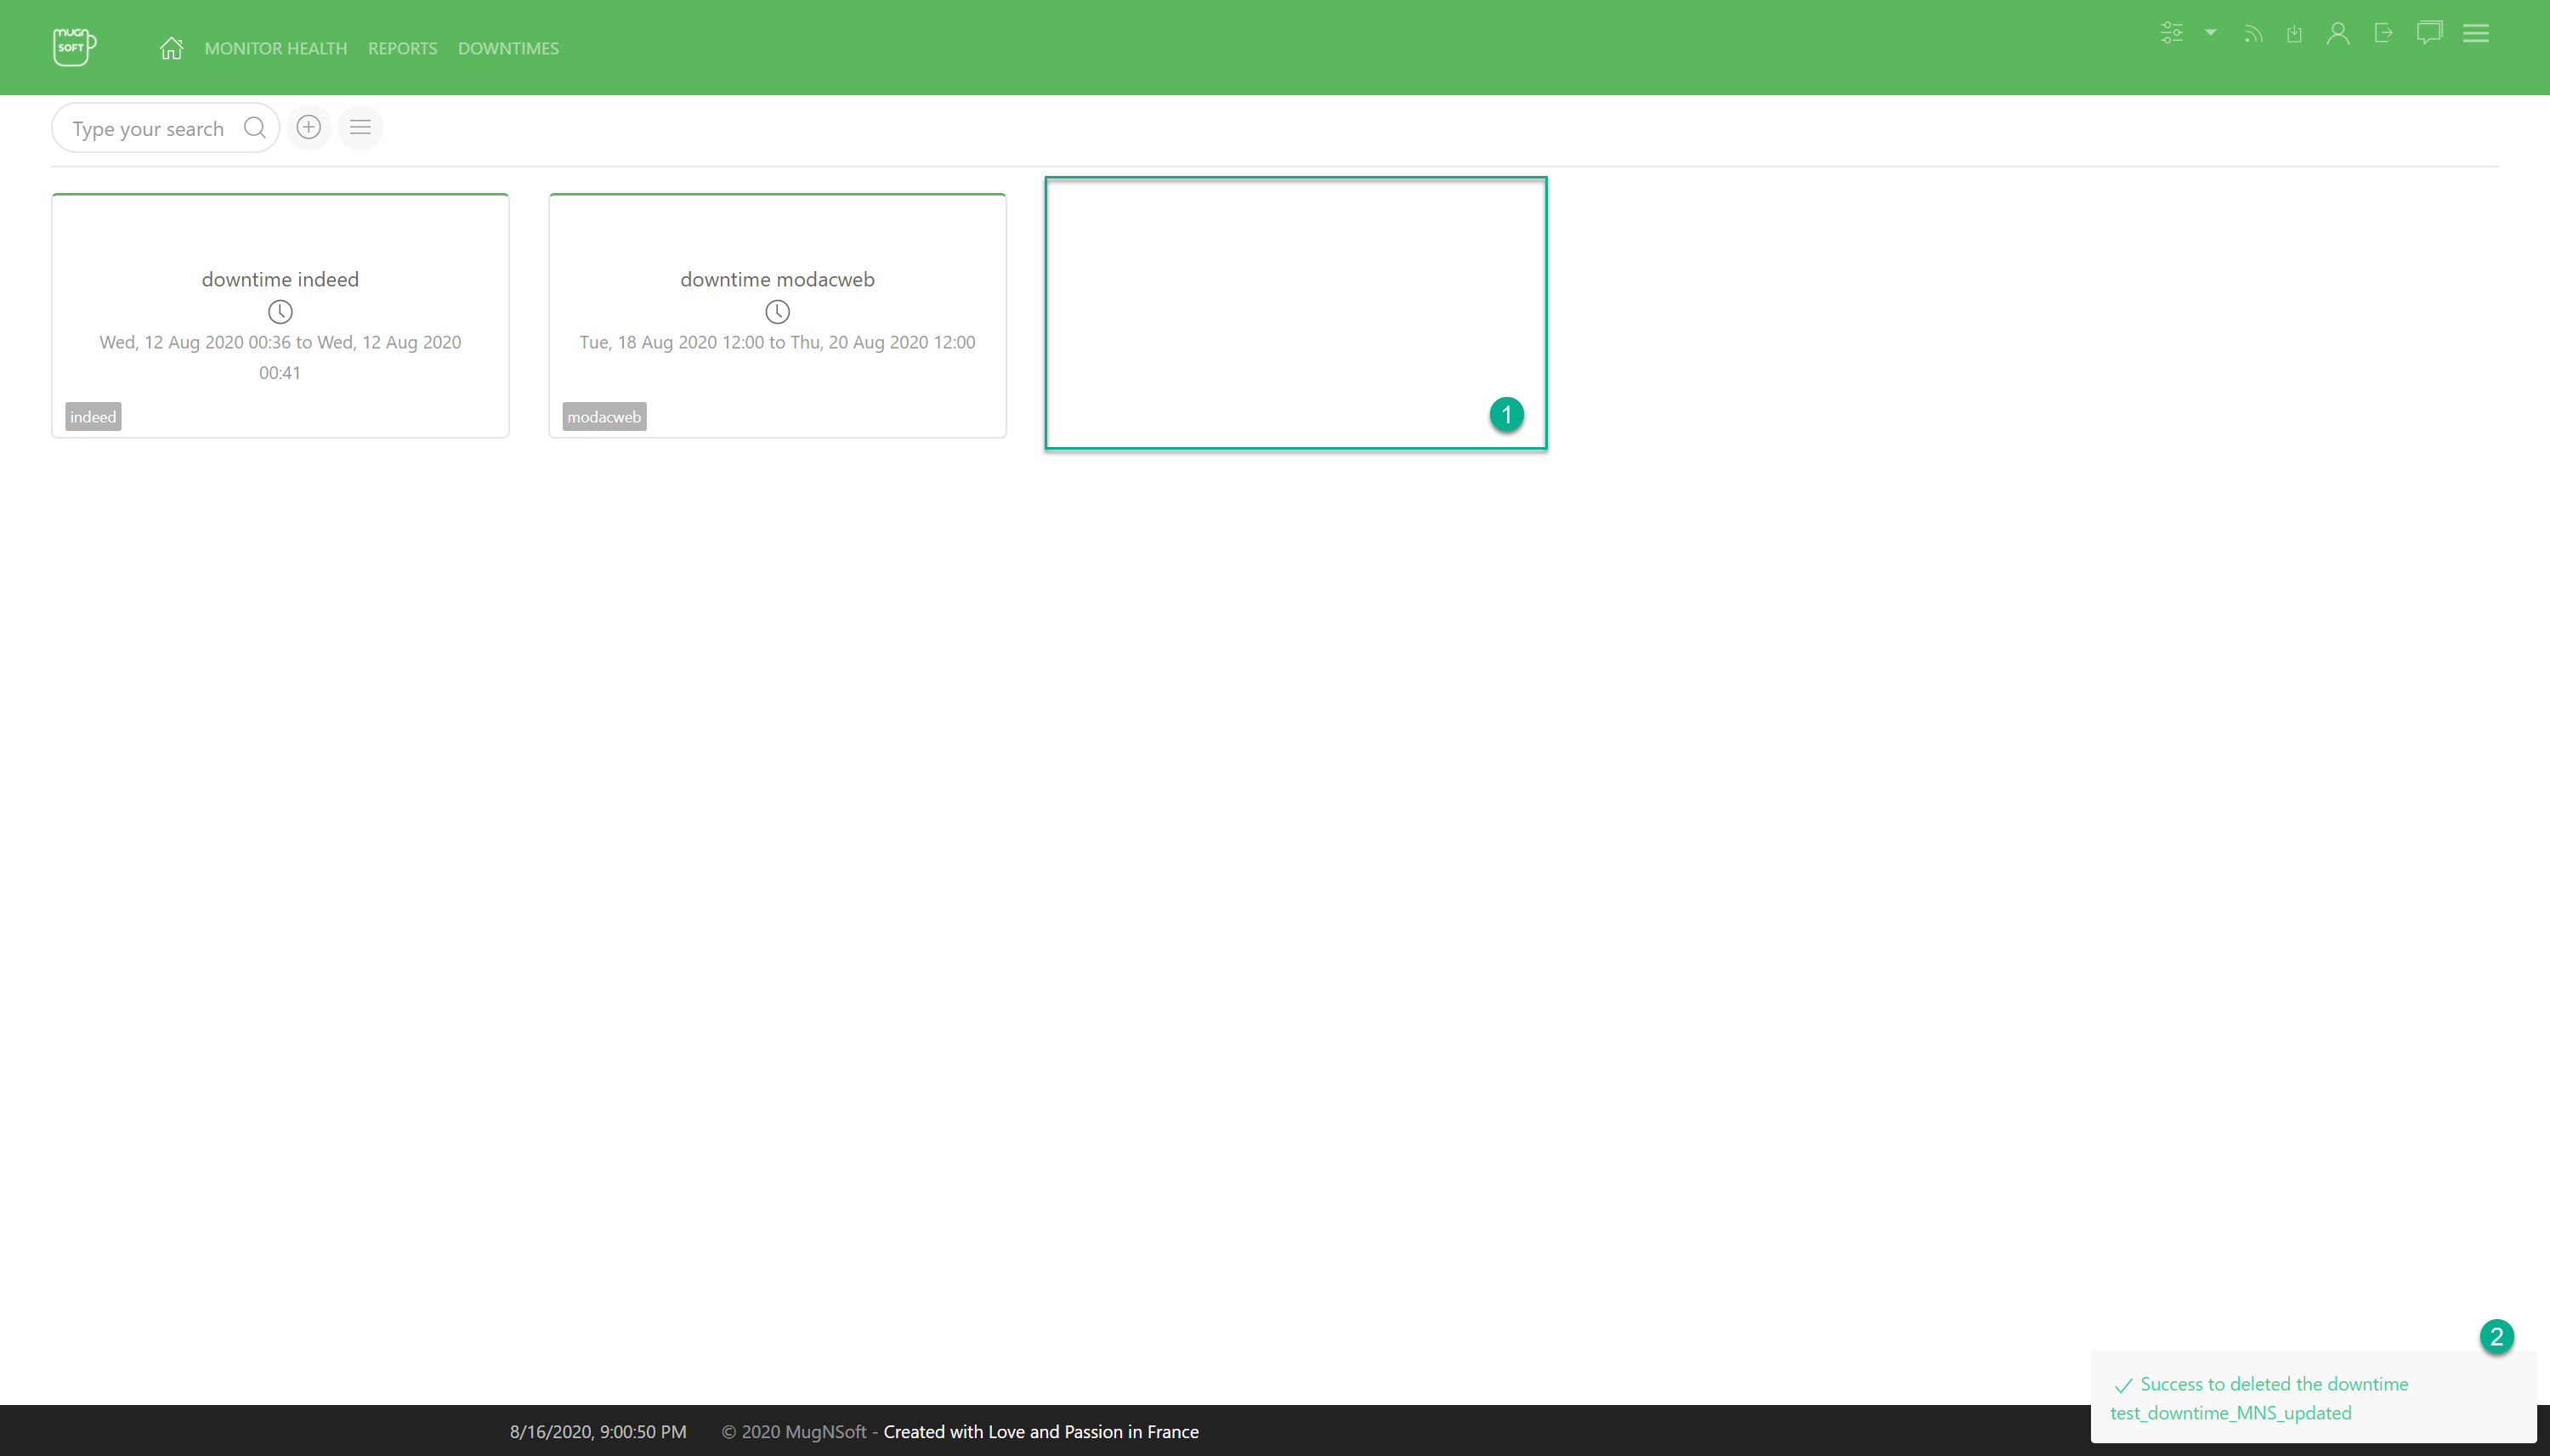
- The downtime is no longer in the list
- The deletion status is displayed in the notification box
Calendar view
Toggle between the default table view and a calendar view using the two buttons above the downtime list (table icon / calendar icon). The calendar view is useful for spotting overlapping maintenance windows at a glance.
- Displays a month grid; navigate with the previous/next arrows.
- Both regular (recurring weekly schedule) and custom (one-off date range) downtimes are expanded into concrete chips on the days they cover. A chip spanning multiple days is truncated with a continuation marker on the days it doesn’t start/end on.
- Chip color distinguishes regular vs custom downtimes; a dimmed style marks a downtime that is
off/done, and a highlighted style marks one currentlyrunning. - A day with more than one downtime active shows an overlap badge (e.g.
3×) in its corner. - Hovering a chip shows its full name, type, time range, state, and owning user.
- Click a chip to open that downtime in the edit/view modal (same as the table’s pencil icon). Right-click a chip for a context menu with the same actions available in the table row (edit, enable/disable, force start/stop, delete).
Filter downtimes
We can filter downtimes based on their state (enabled/disabled) or their name.
- Click on the given button to toggle the filter
- Click on any of these value to filter based on the state
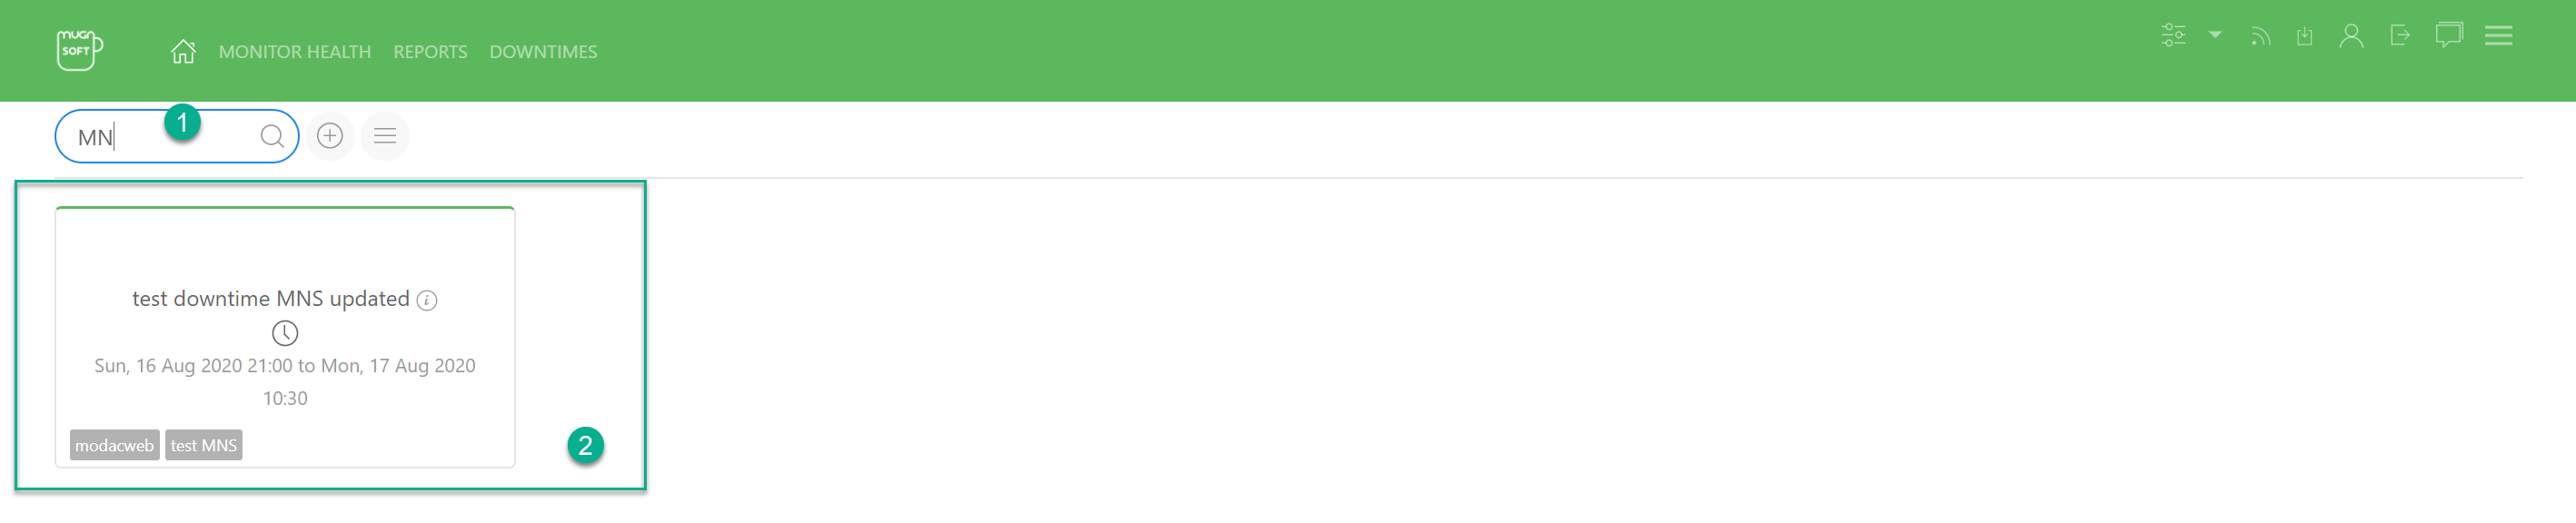
- Type in case sensitive pattern (part of the downtimename, tag, monitor) and type enter

- Type in “MN” and type enter
- Downtimes matching this criteria should appears in the list
See also
- App definition and data modelling — how tags and applications structure the monitor inventory that downtimes target
- Monitor operations — managing the monitors a downtime silences
- Report operations — scheduled reports built on the same tag/monitor scoping model