Send data to Splunk
In order to send data to splunk, we will need to add an index and a correpondant Splunk’s HTTP/HTTPS Event Collector (HEC).
We need to first configure Splunk to receive json data from Mugnsoft integrator by creating an index called Mugnsoft in Splunk, then enabling the HEC and creating an access token. Then we will define a Mugnsoft integrator component that will forward data of monitors to the defined Splunk instance.
Note:
Please for more details refer to https://docs.splunk.com/Documentation/Splunk/8.1.1/Data/UsetheHTTPEventCollector
We assume that there is no firewall rule preventing Mugnsoft integrator to communicate with Splunk HEC. We assume that you have the right credentials to perform Splunk HEC configuration.
Configure Mugnsoft’s integration with Splunk
Create an index and Splunk HEC using the terminal
Copy/paste the following commands in a terminal of your choice, do not forget to change the requirred fields.
-
This command will create an index, conserve the index_name and update splunkIndex in Mugnsoft :
curl -k -u admin:<changeme2-password> https://localhost:8089/services/data/indexes -d name=<changeme2-index_name> -
This command will create an HEC and return the token which should be conserved and used to update splunkAuthorizationToken in Mugnsoft :
curl -k -u admin:<changeme2-password> https://localhost:8089/servicesNS/admin/splunk_httpinput/data/inputs/http -d name=<changeme2-HEC_name> -d index=<changeme2-index_name> | grep '<s:key name="token">' | awk -F'>' '{ print $2 }' | awk -F'<' '{ print $1 }
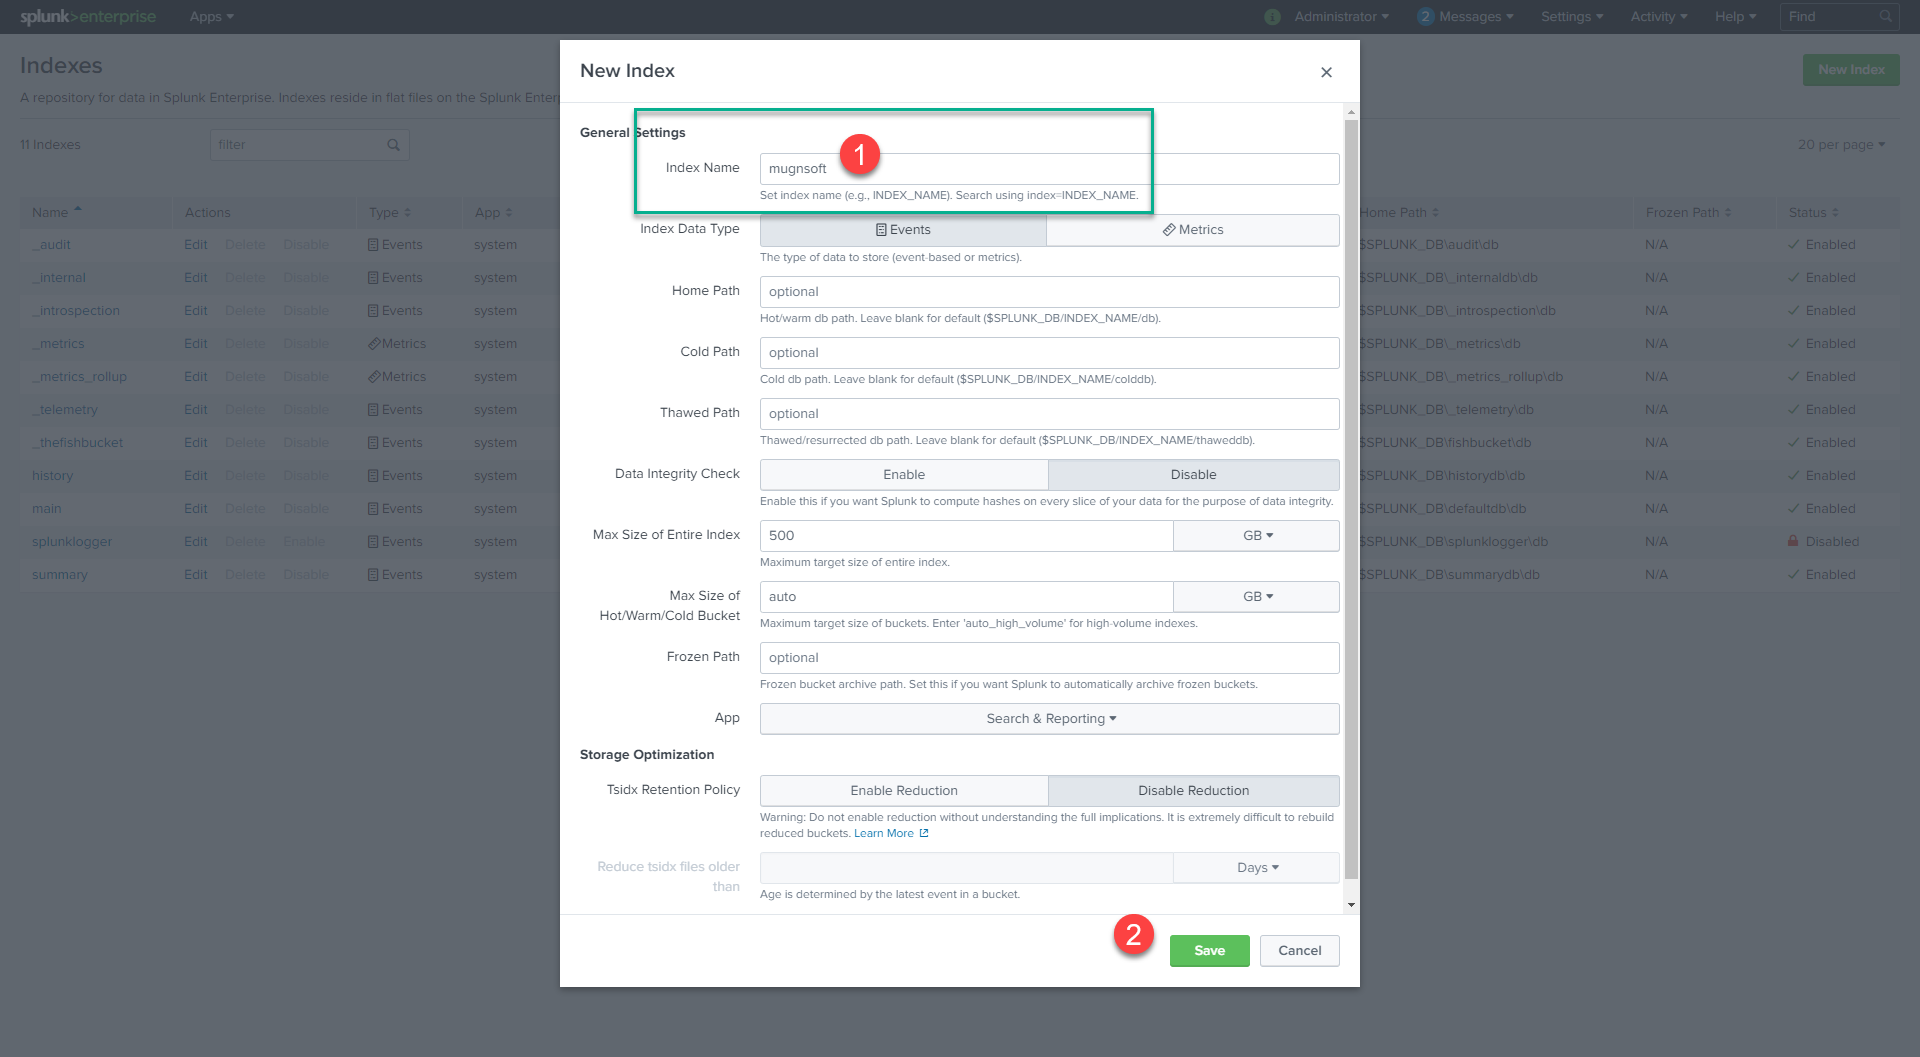
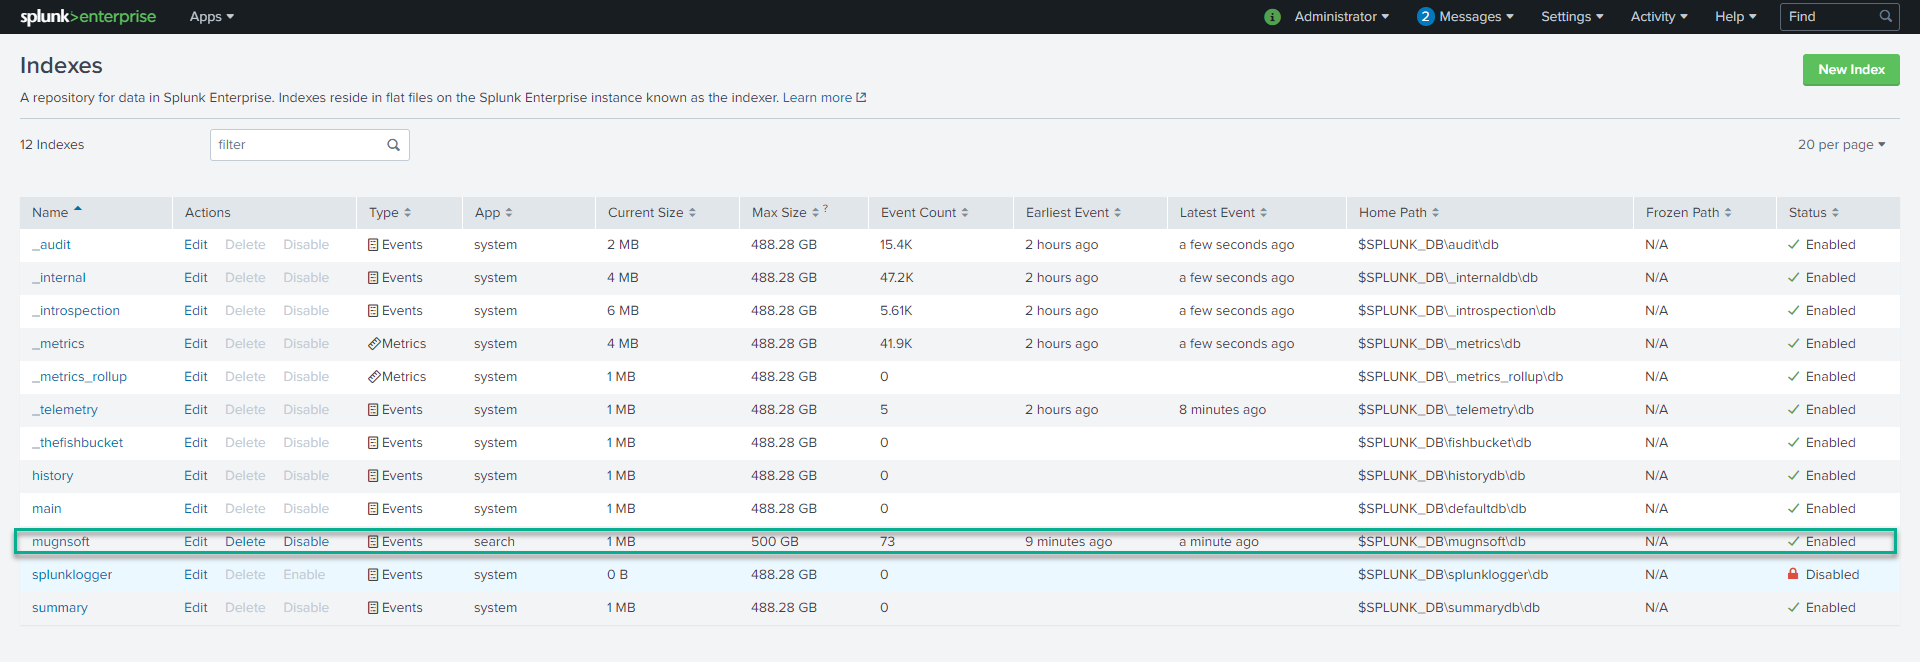
Create the Mugnsoft index
Before you enable Http Event Collector, let’s define the index that will store our Mugnsoft’s monitors’ event.
- Click Settings > Indexes.
- Click New Index.
- Give it the following name Mugnsoft. Please give that exact index name.
- Save that Index.
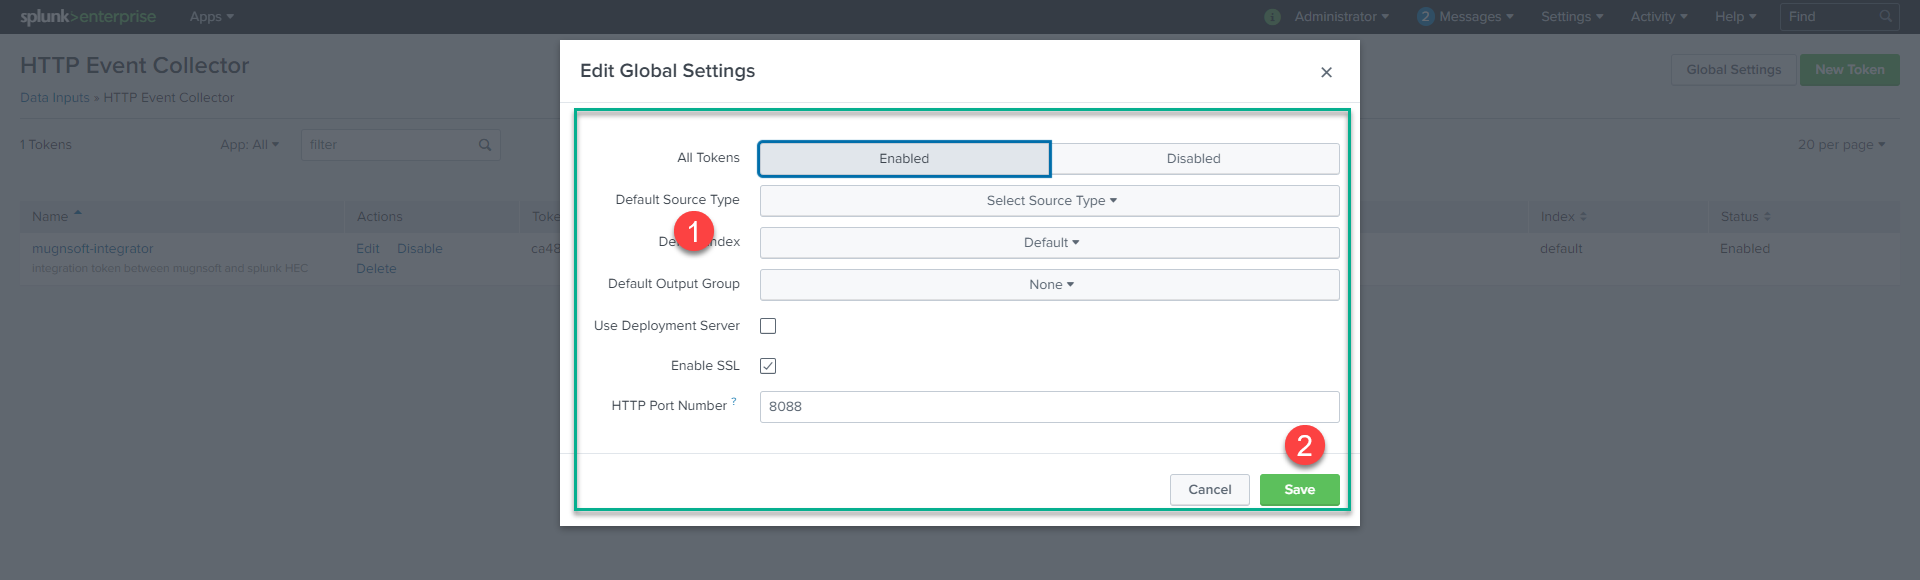
Enable HTTP Event Collector
Before you can use Event Collector to receive events through HTTP, you must enable it. For Splunk Enterprise, enable HEC through the Global Settings dialog box.
- Click Settings > Data Inputs.
- Click HTTP Event Collector.
- Click Global Settings.
- In the All Tokens toggle button, select Enabled.
- (Optional) Choose a Default Source Type for all HEC tokens. You can also type in the name of the source type in the text field above the drop-down before choosing the source type.
- (Optional) Choose a Default Index for all HEC tokens.
- (Optional) Choose a Default Output Group for all HEC tokens.
- (Optional) To use a deployment server to handle configurations for HEC tokens, click the Use Deployment Server check box.
- (Optional) To have HEC listen and communicate over HTTPS rather than HTTP, click the Enable SSL checkbox.
- (Optional) Enter a number in the HTTP Port Number field for HEC to listen on. Note: Confirm that no firewall blocks the port number that you specified in the HTTP Port Number field, either on the clients or the Splunk instance that hosts HEC.
- Click Save.
Create an Event Collector token
To use HEC, you must configure at least one token.
- Click Settings > Add Data.
- Click monitor.
- Click HTTP Event Collector.
- In the Name field, enter a name for the token.
- (Optional) In the Source name override field, enter a source name for events that this input generates.
- (Optional) In the Description field, enter a description for the input.
- (Optional) In the Output Group field, select an existing forwarder output group.
- (Optional) If you want to enable indexer acknowledgment for this token, click the Enable indexer acknowledgment checkbox.
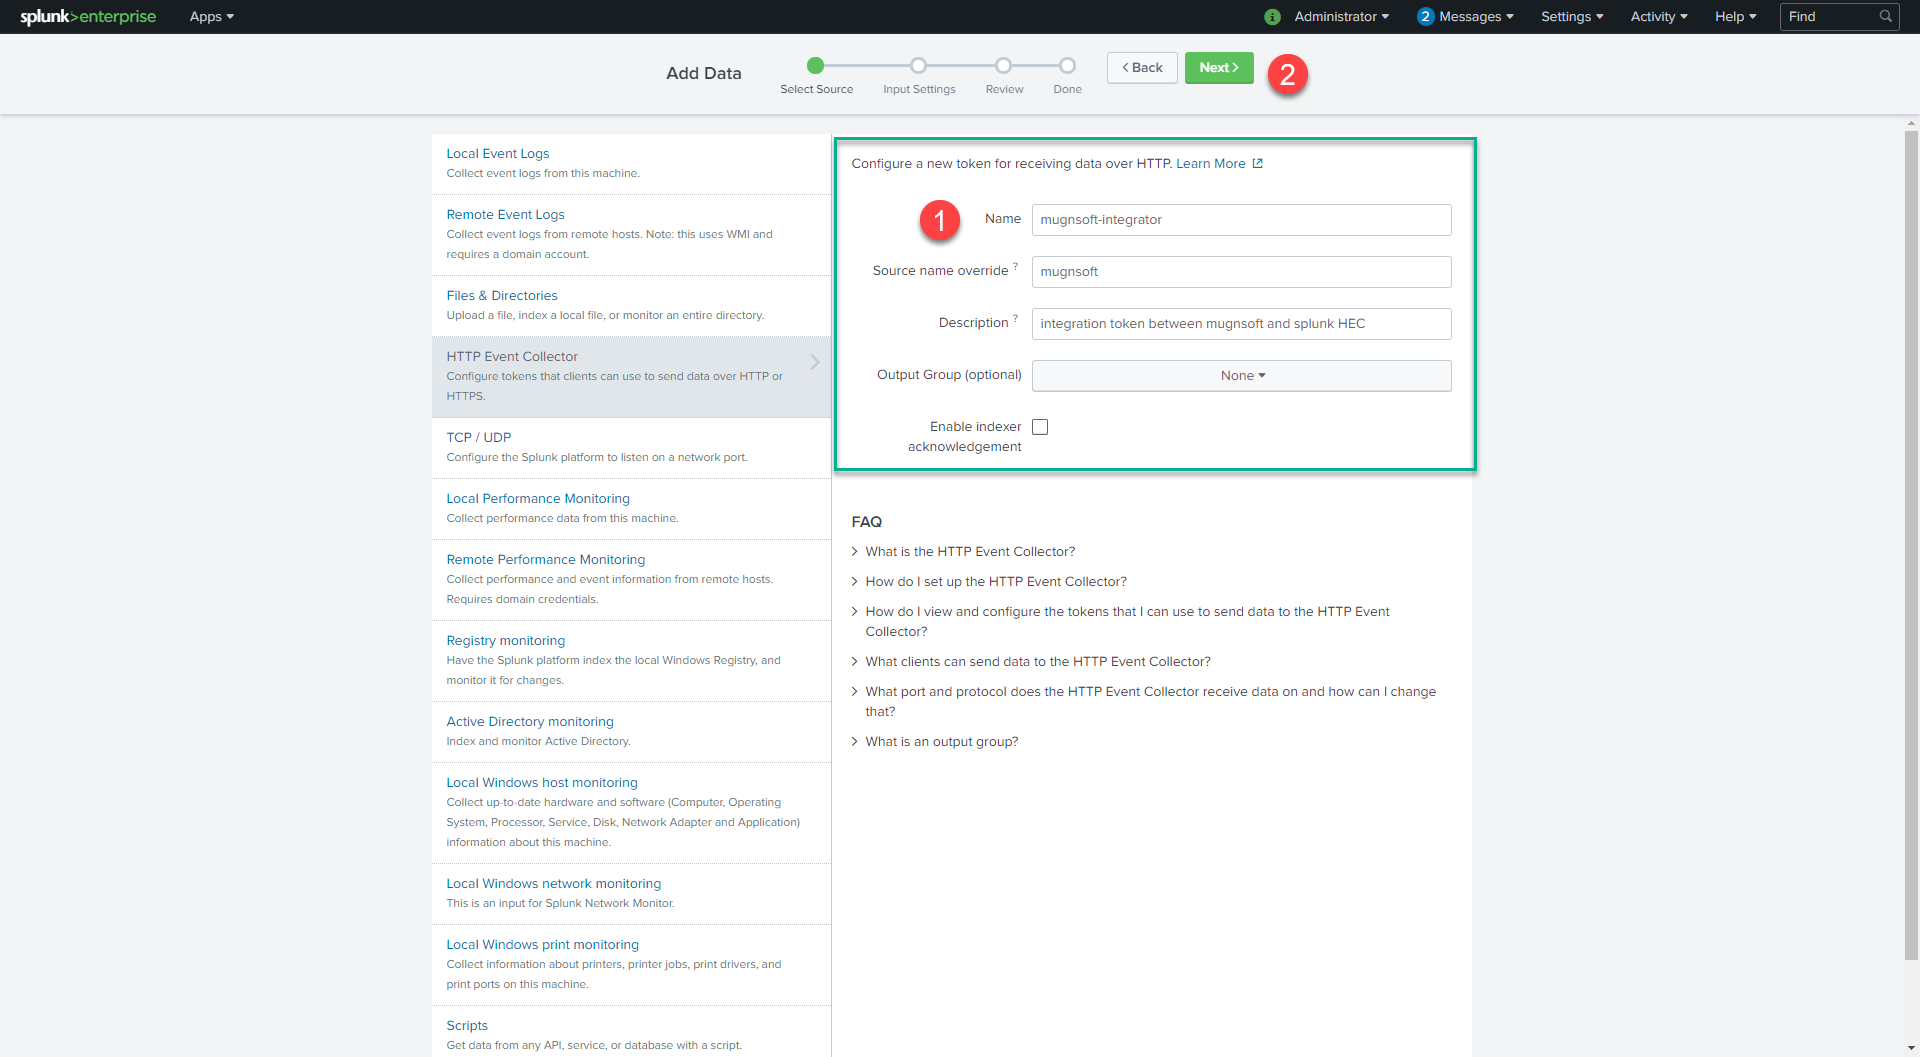
- Click Next.
- (Optional) Confirm the source type and the index for HEC events.
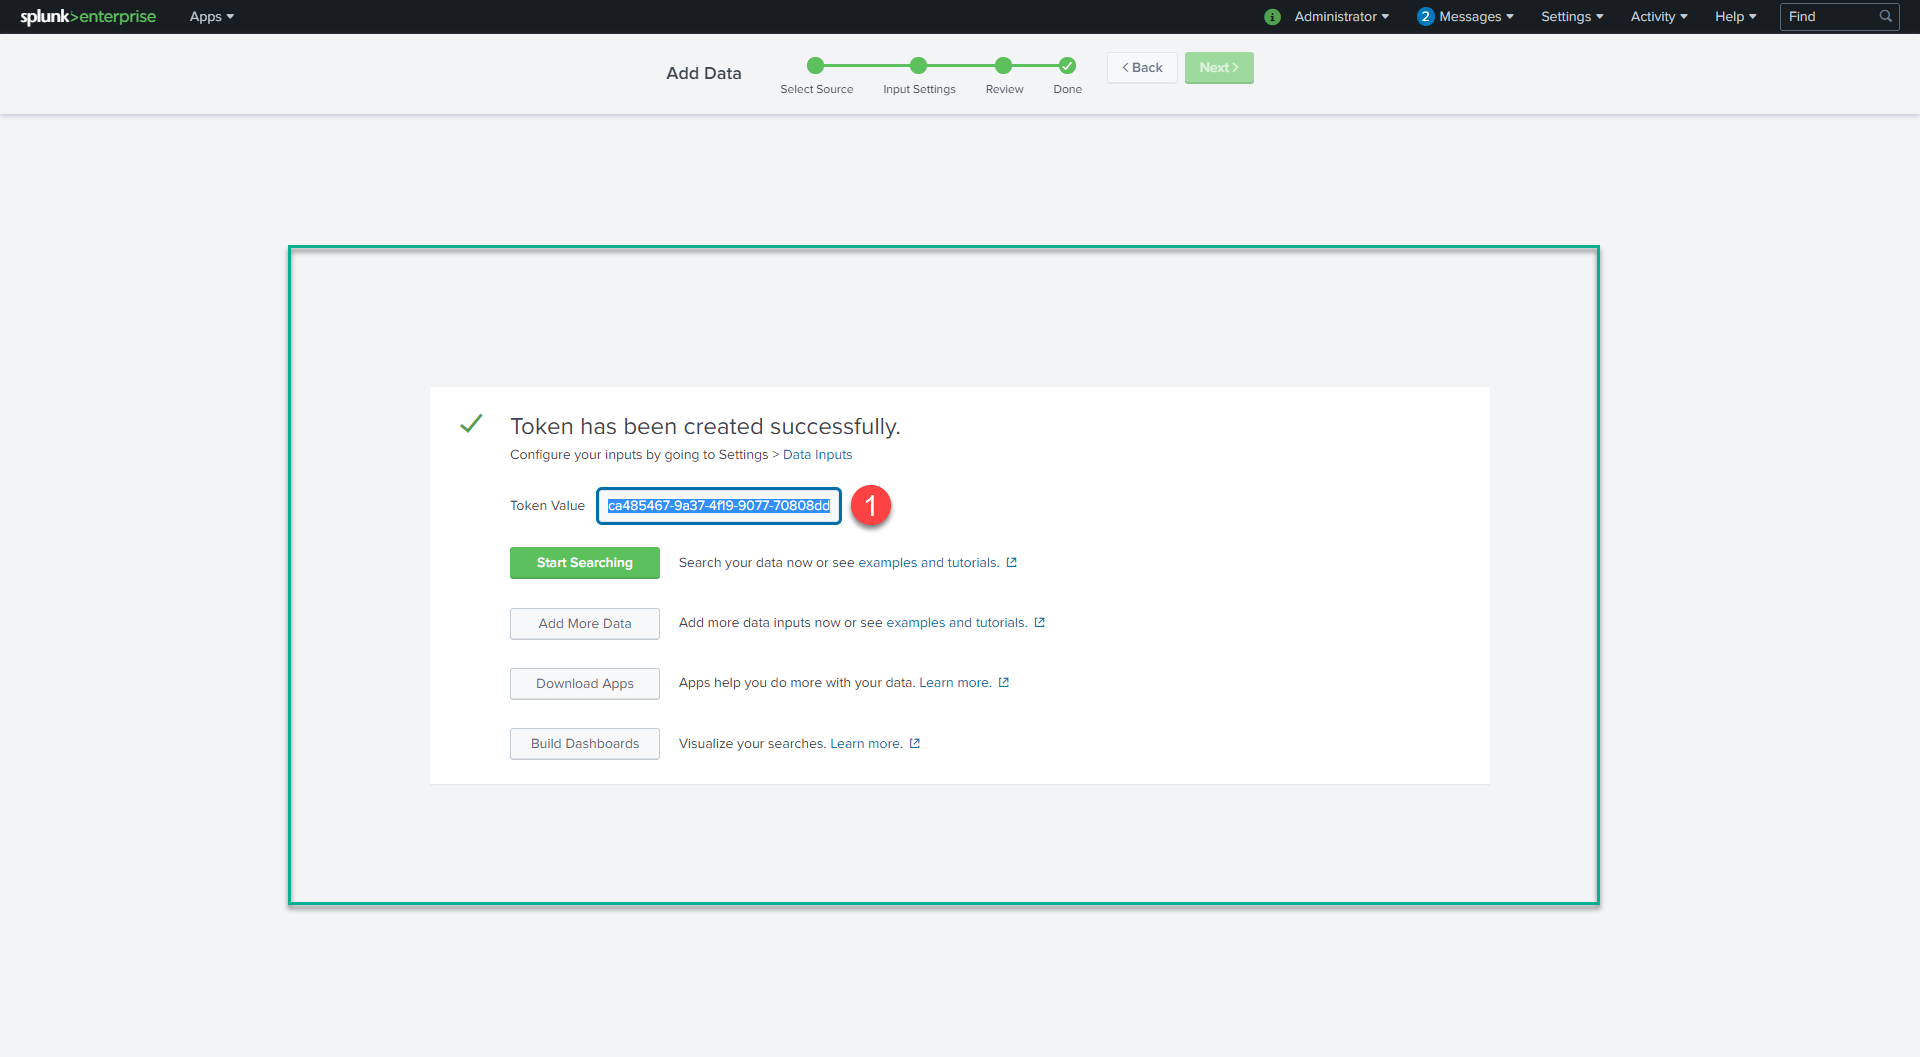
- Click Review.
- Confirm that all settings for the endpoint are what you want.
- If all settings are what you want, click Submit. Otherwise, click < to make changes.
- Copy the token value that Splunk Web displays (we will need it when configuring Mugnsoft’s integrator).
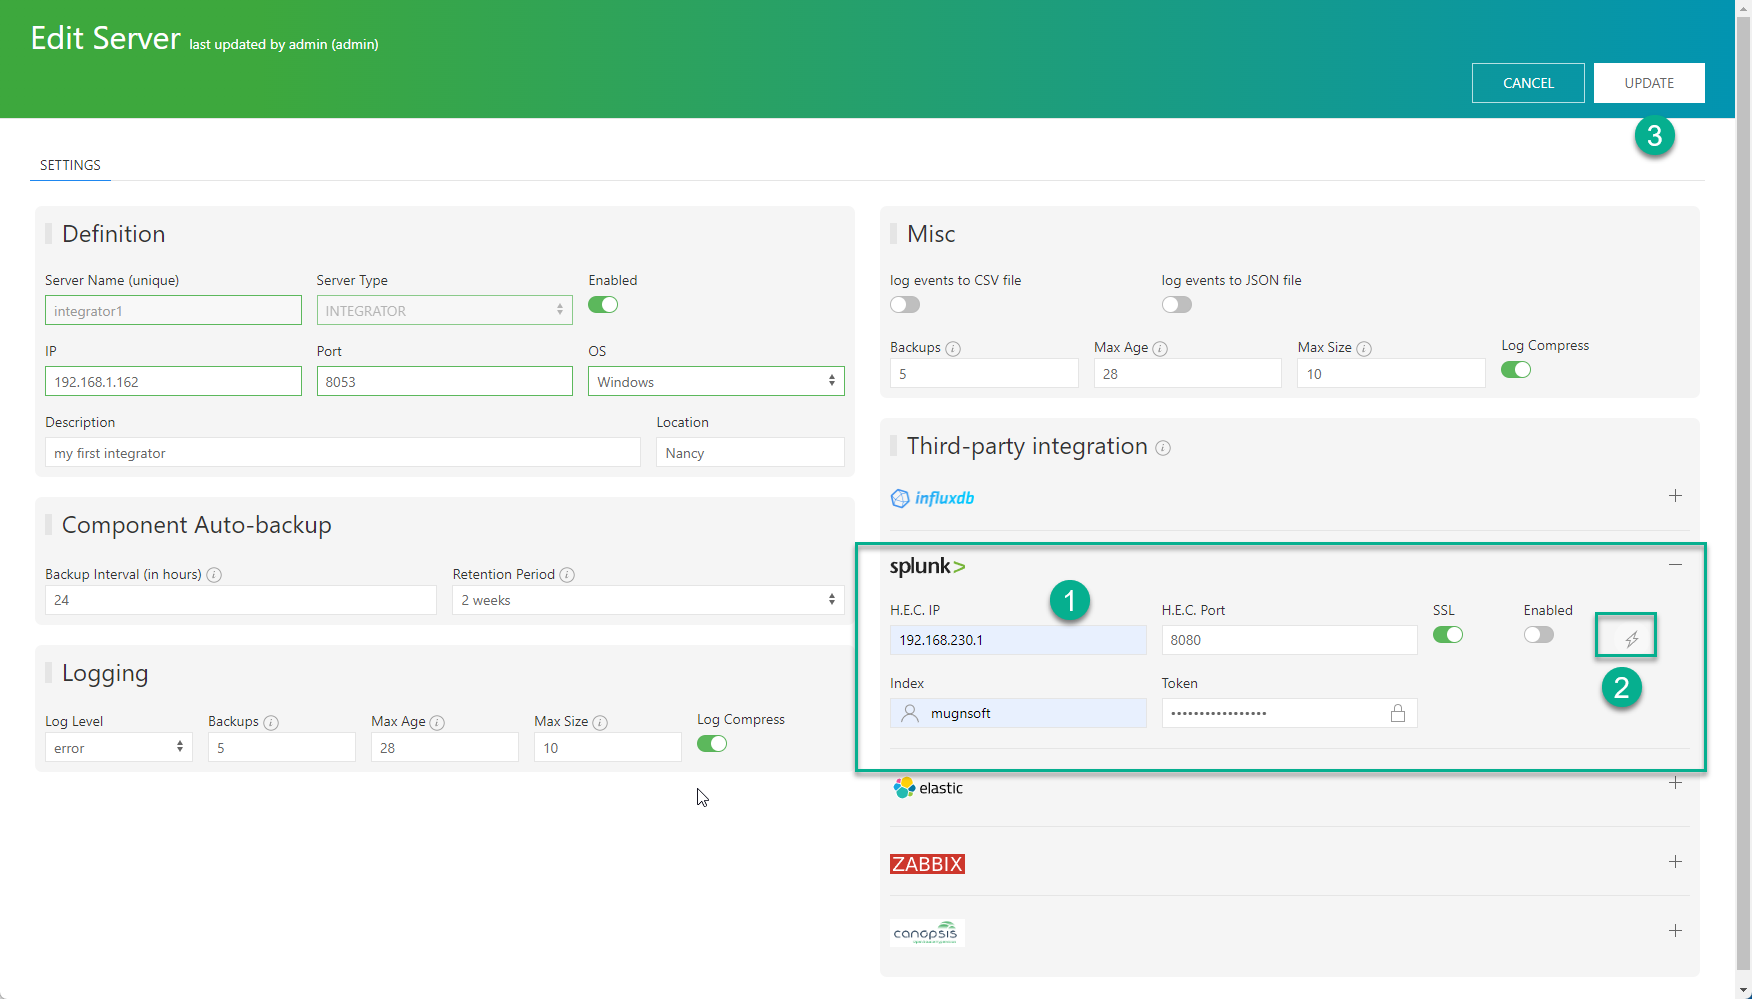
Add/Update the Mugnsoft integrator with Spunk info
Update or add a Mugnsoft integrator component with Spunk info and the freshly created token. Do not forget to check the Enabled box.
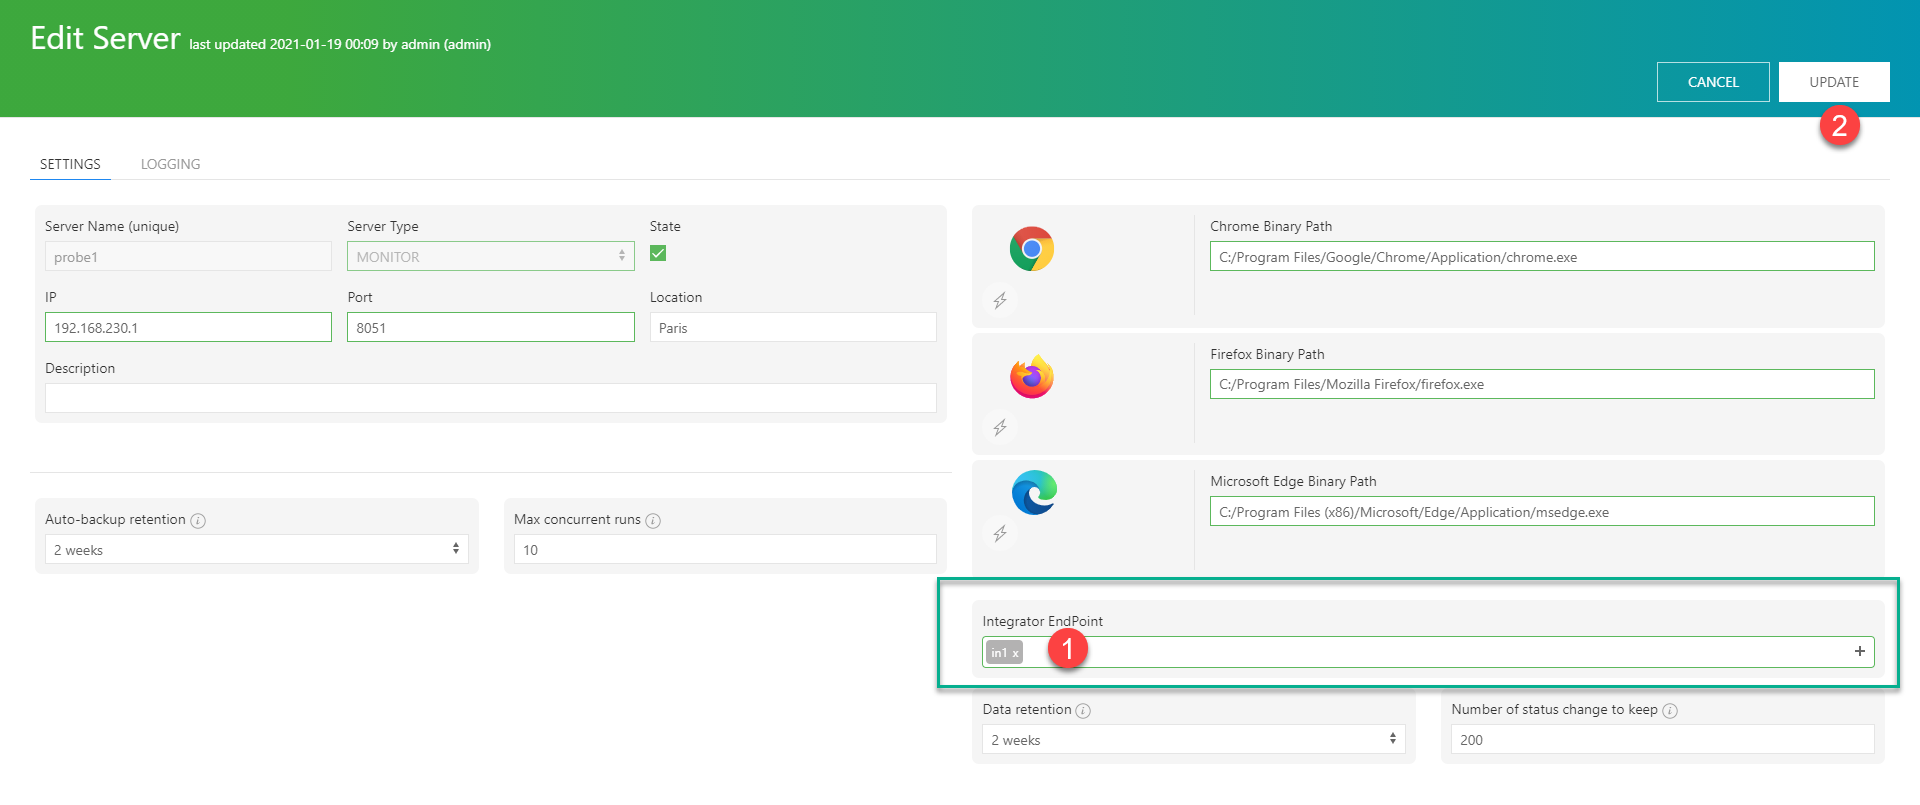
relate the Mugnsoft integrator to its monitor (if not already done)
Attached this integrator component to a selected Mugnsoft monitor component.
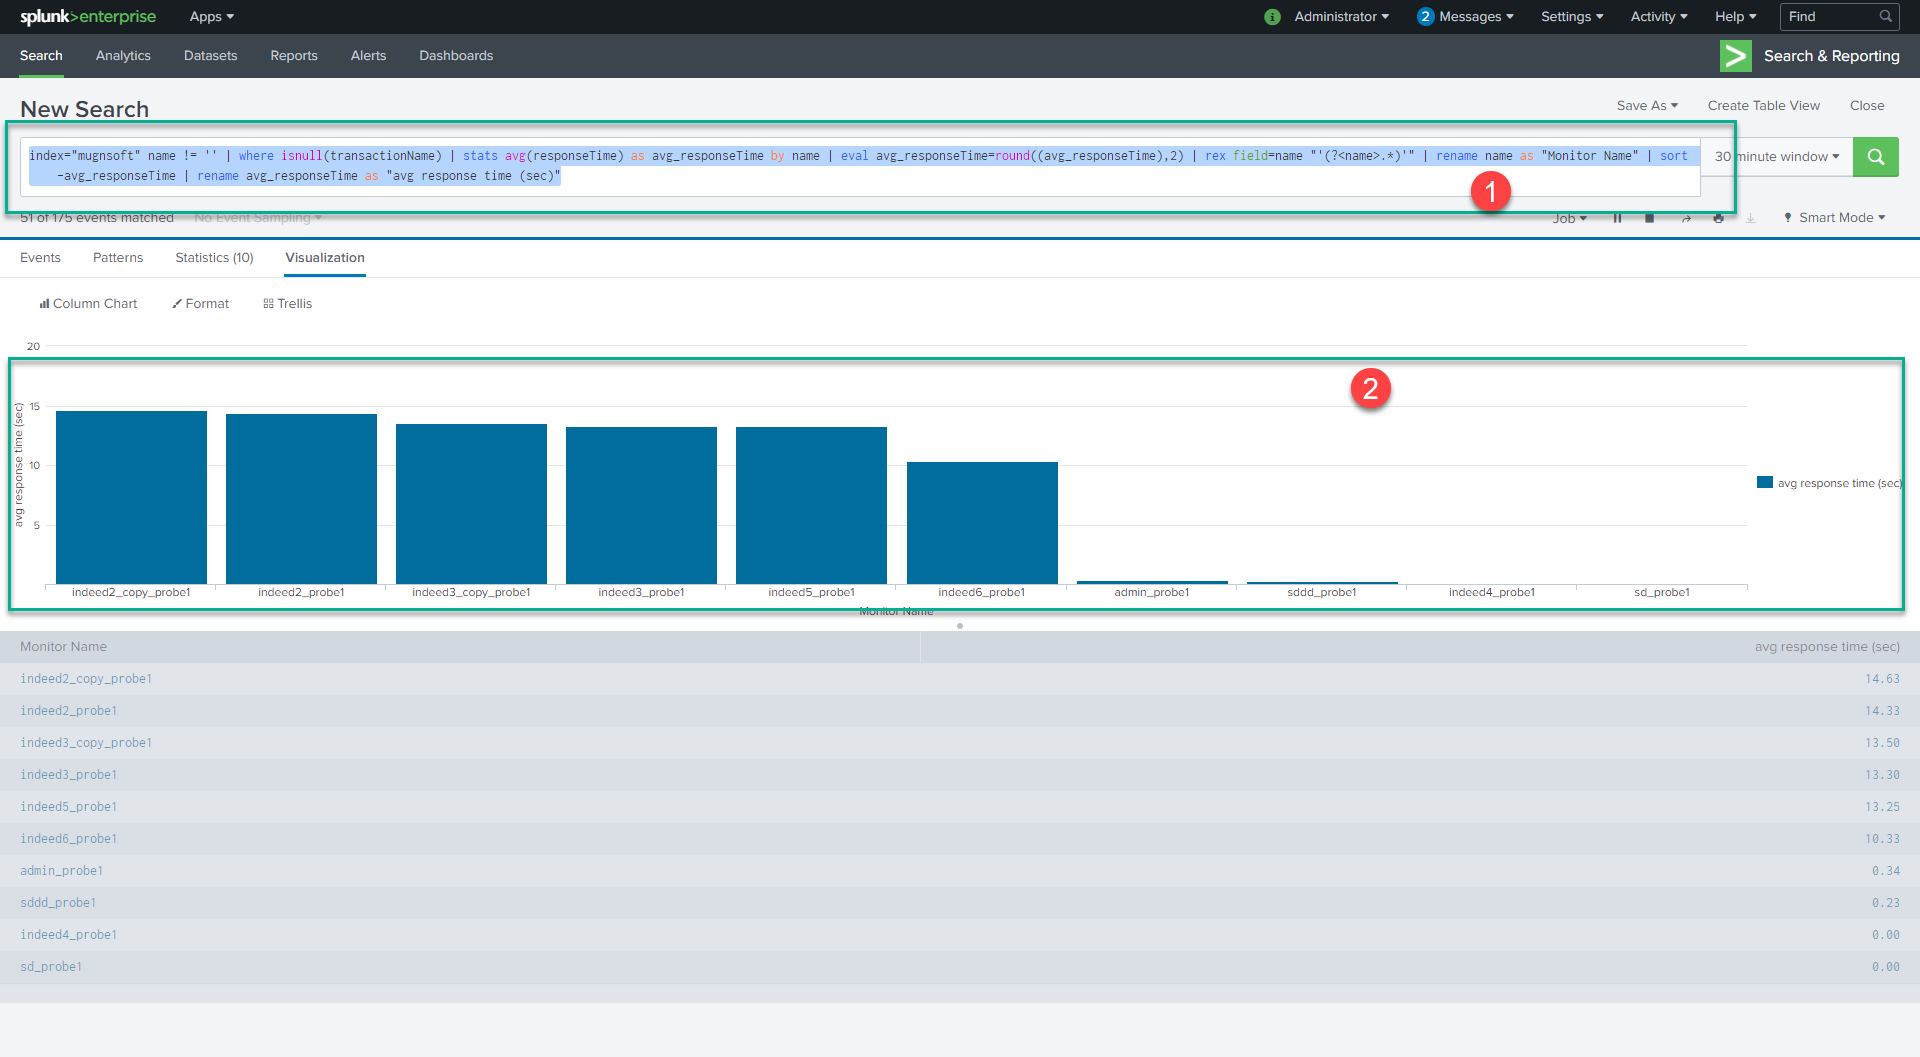
Check your Splunk’s Search & Reporting dashboard
You will start receiving some events in Splunk.
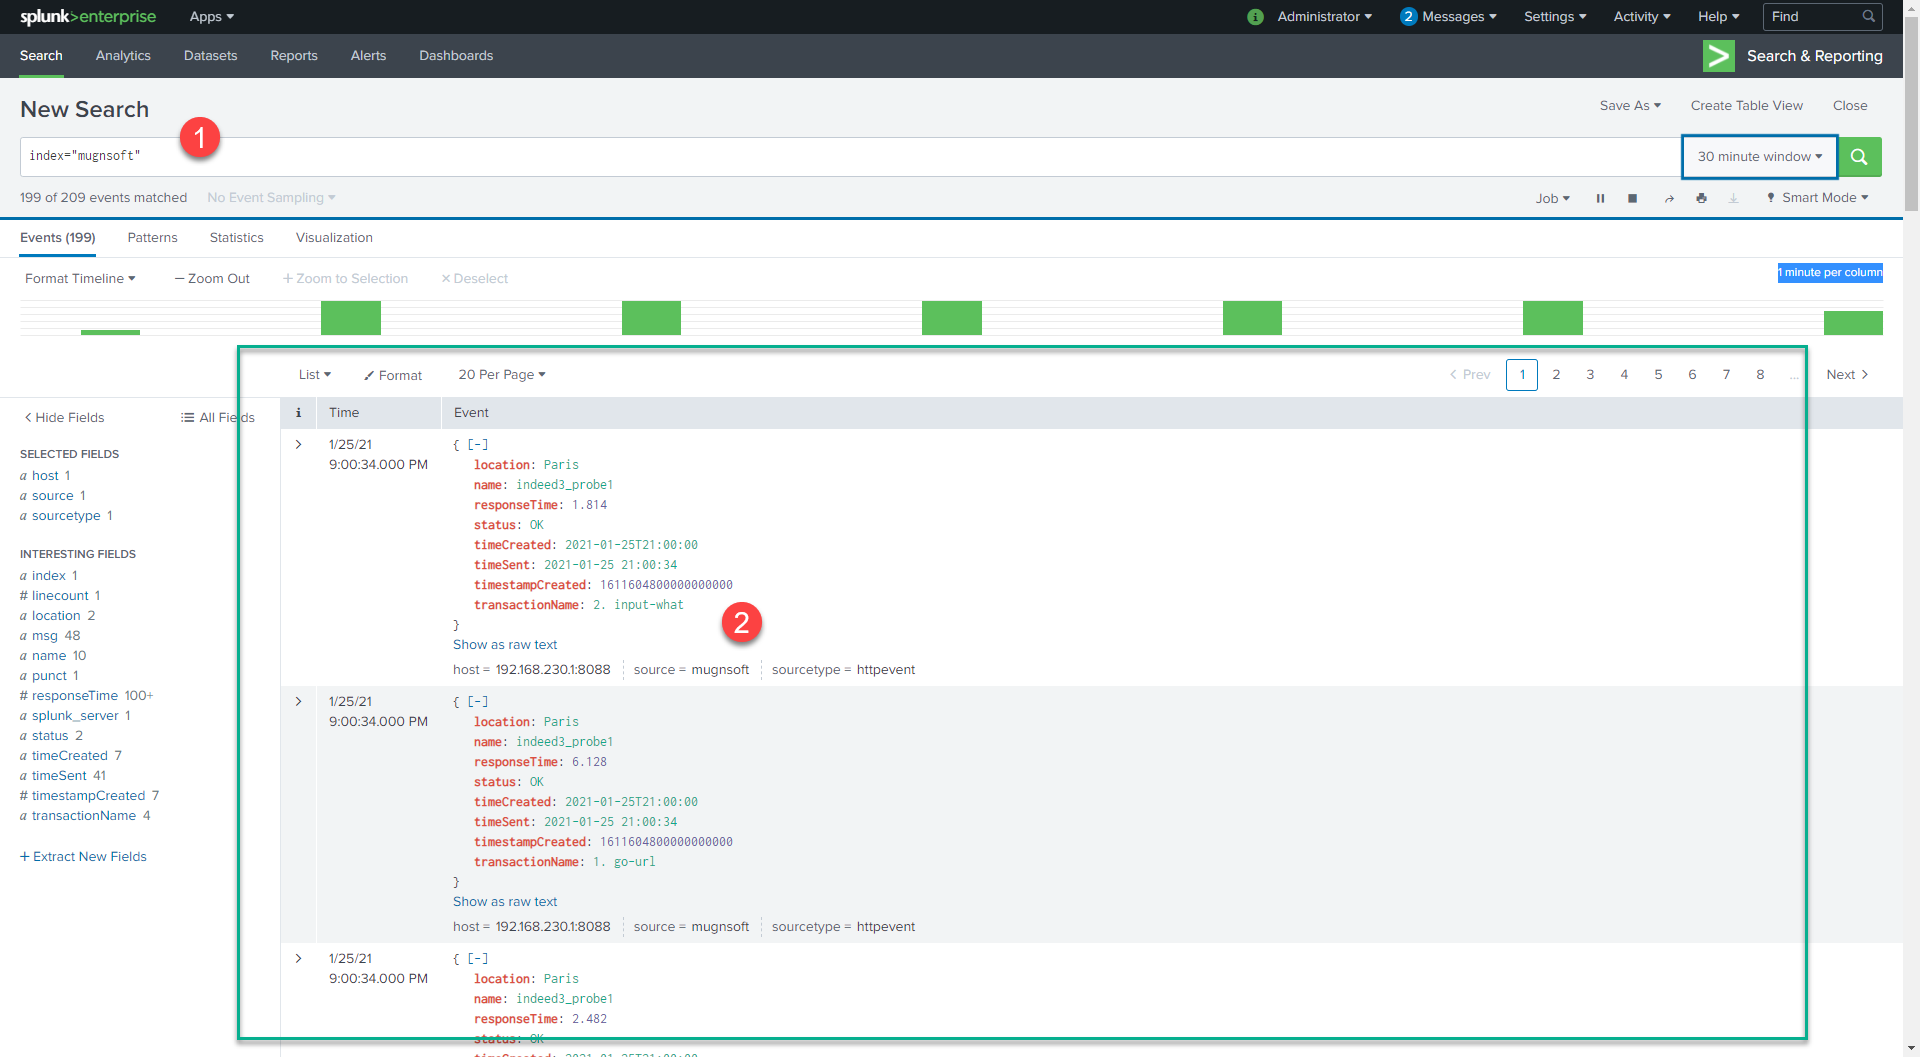
Copy/paste the below SPL to get some statistics on your monitors global average response time.
index="Mugnsoft" name != '' |
where isnull(transactionName) |
stats avg(responseTime) as avg_responseTime by name |
eval avg_responseTime=round((avg_responseTime),2) |
rex field=name "'(?<name>.*)'" |
rename name as "Monitor Name" |
sort -avg_responseTime |
rename avg_responseTime as "avg response time (sec)"
Disable the Mugnsoft/Splunk integration
If you want to stop sending the monitors’ data to Splunk. Edit the integrator component and uncheck the “Enabled” checkbox.