Monitor operations
You can perform various operations on the monitor. See below what you can perform.
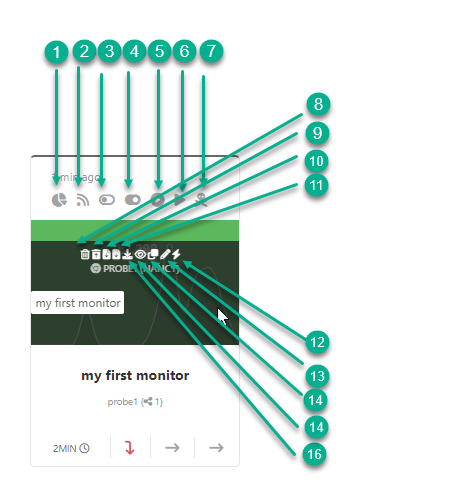
Available operations
-
Display the monitor report. Go to display report.
-
Live view the monitor execution. Go to live view.
-
Disable the monitor execution. Go to Disable monitor.
-
Enable the monitor execution. Go to run browser mode.
-
Run monitor in browser mode on the MNS Monitor. Go to run browser mode.
-
Run monitor in headless mode on the MNS Monitor. Go to run headless mode.
-
Kill the monitor execution. Go to kill a running monitor.
-
Delete the monitor. Go to delete monitor.
-
Clean the monitor’s data. Go to clean monitor.
-
Download the last monitor’s logfile. Go to last logfile monitor.
-
Download the last monitor’s HAR file. Go to last HAR monitor.
-
Download the monitor’s run files. Go to download run files.
-
View the monitor. Go to view monitor.
-
Duplicate the monitor. Go to duplicate monitor.
-
Edit the monitor. Go to edit monitor.
-
Compute and set the monitor threshold base on history executions. Go to compute threshold monitor.
Once logged in, you can perform the below operations.
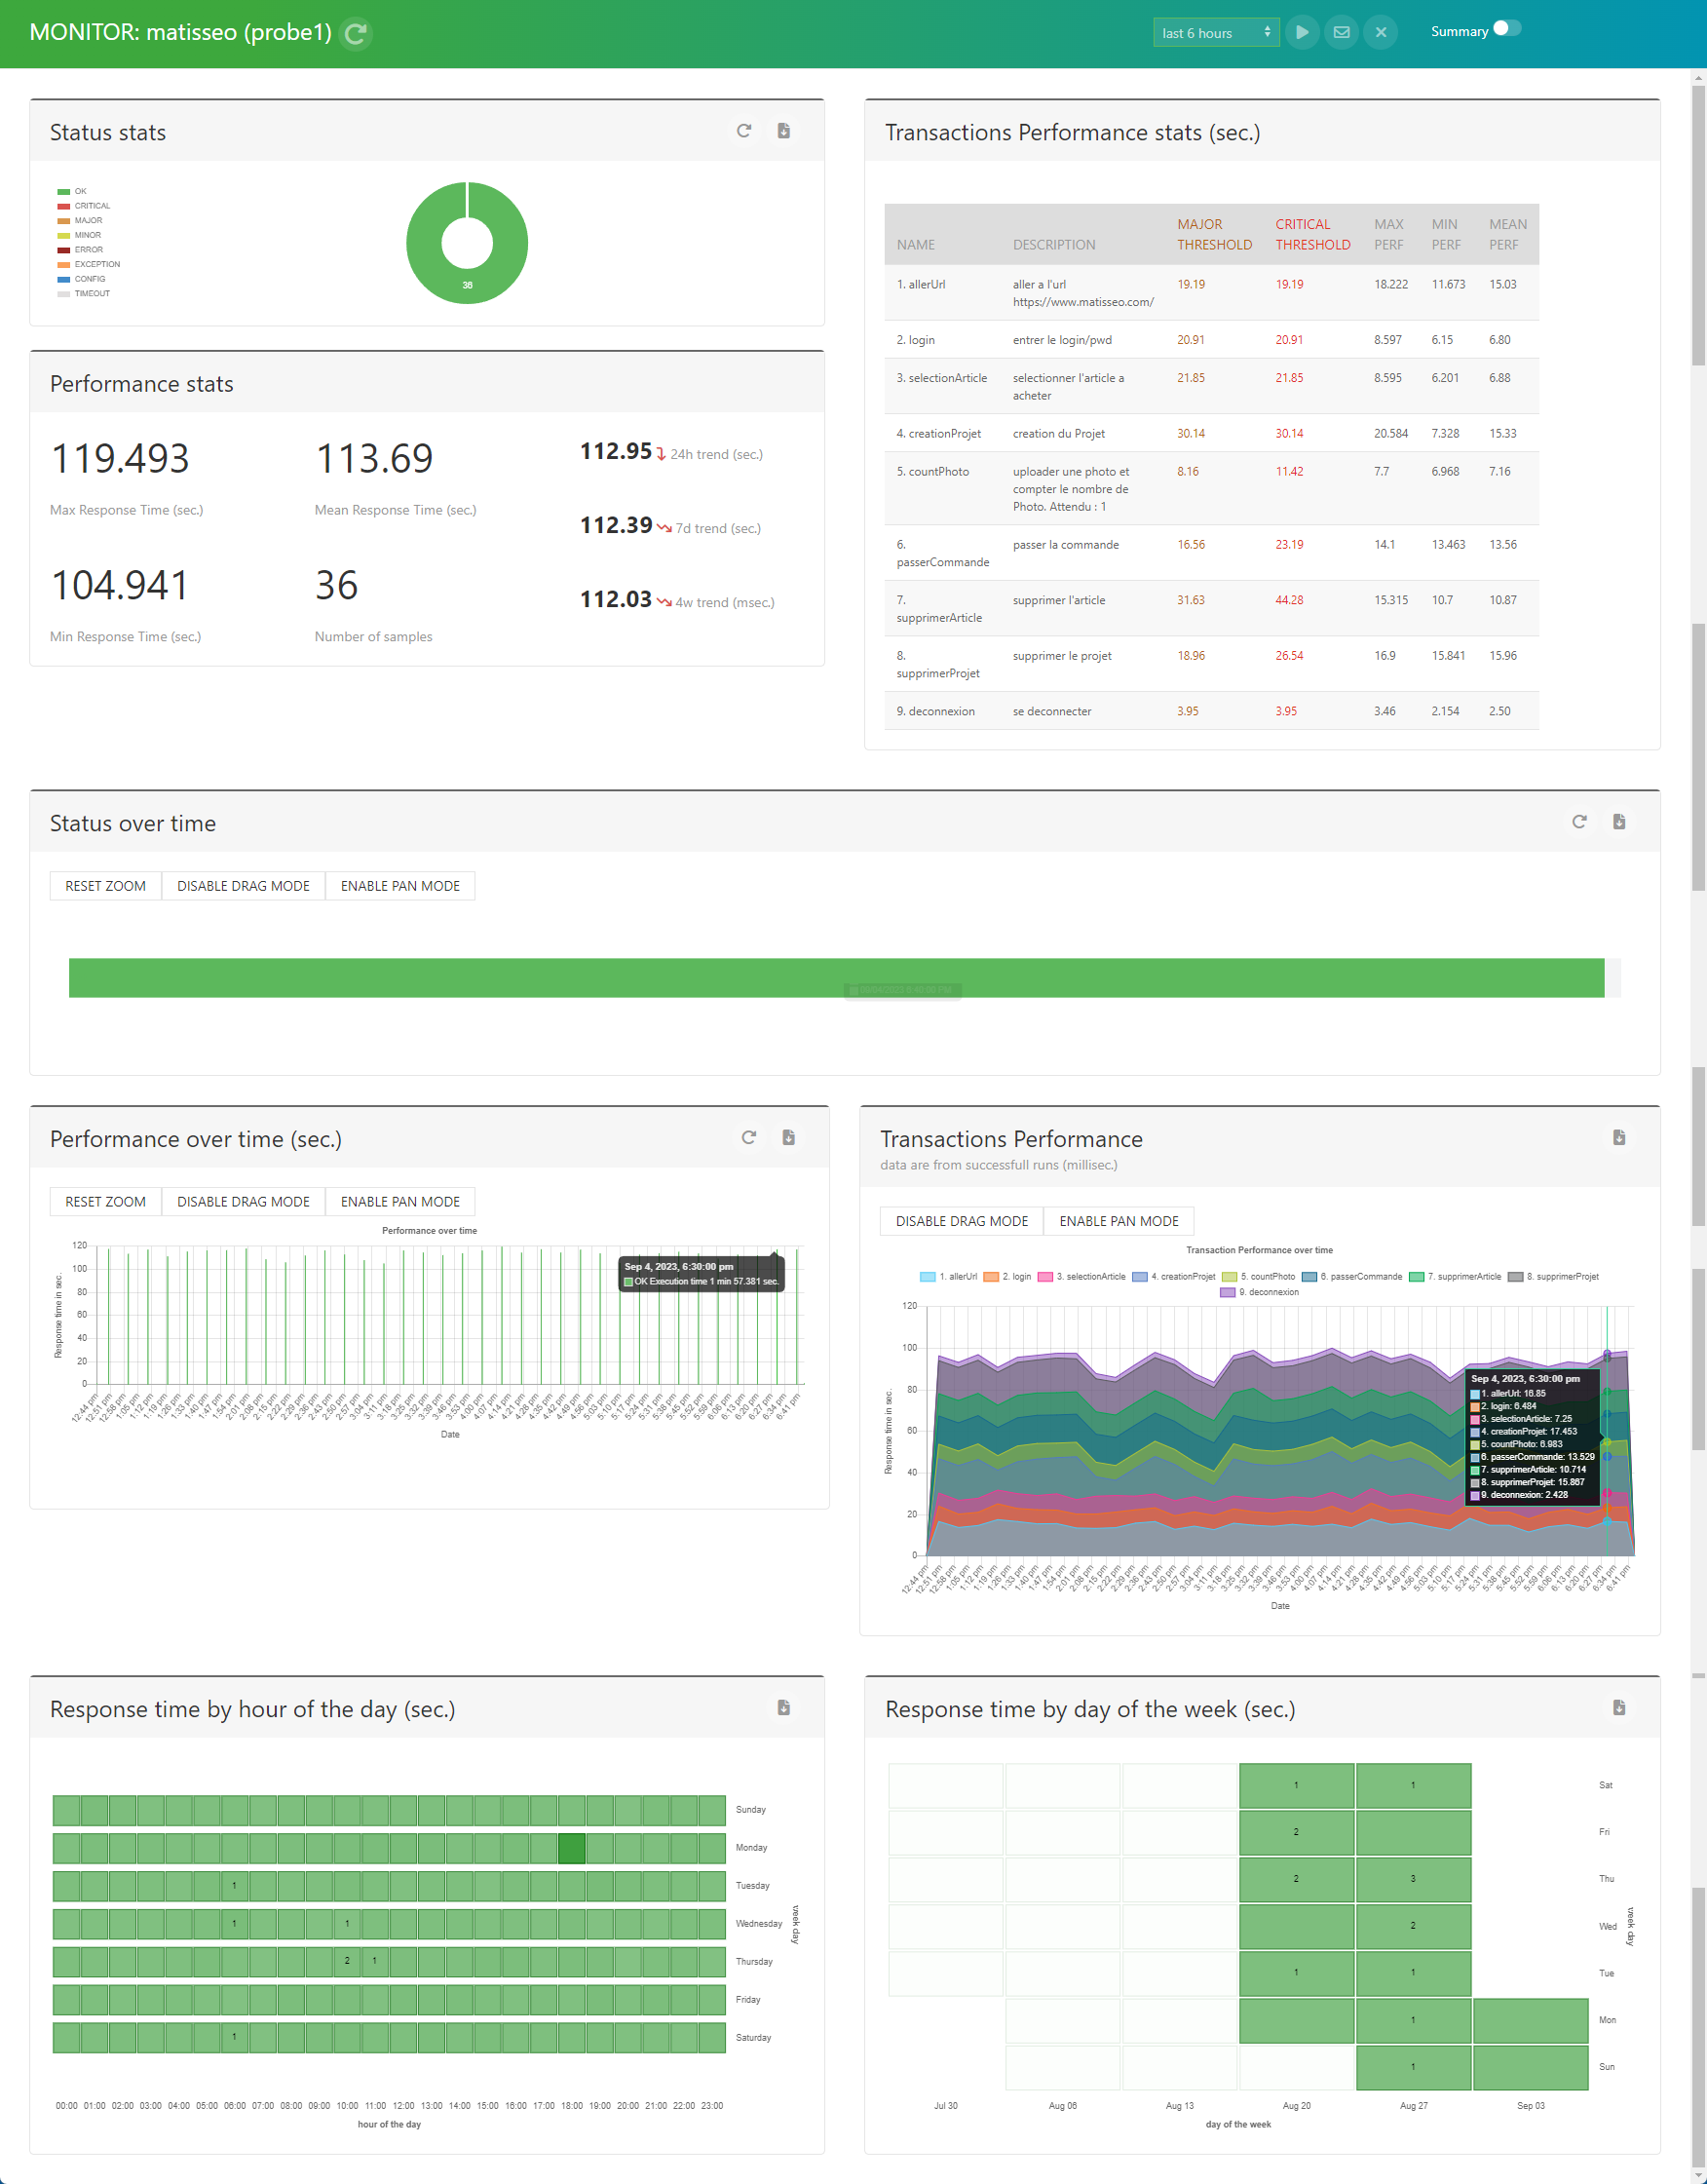
Display report
- hover on the monitor and click on the report icon
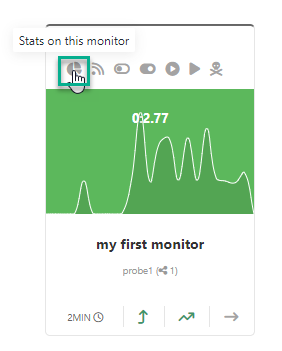
- the report shows up in a modal windows
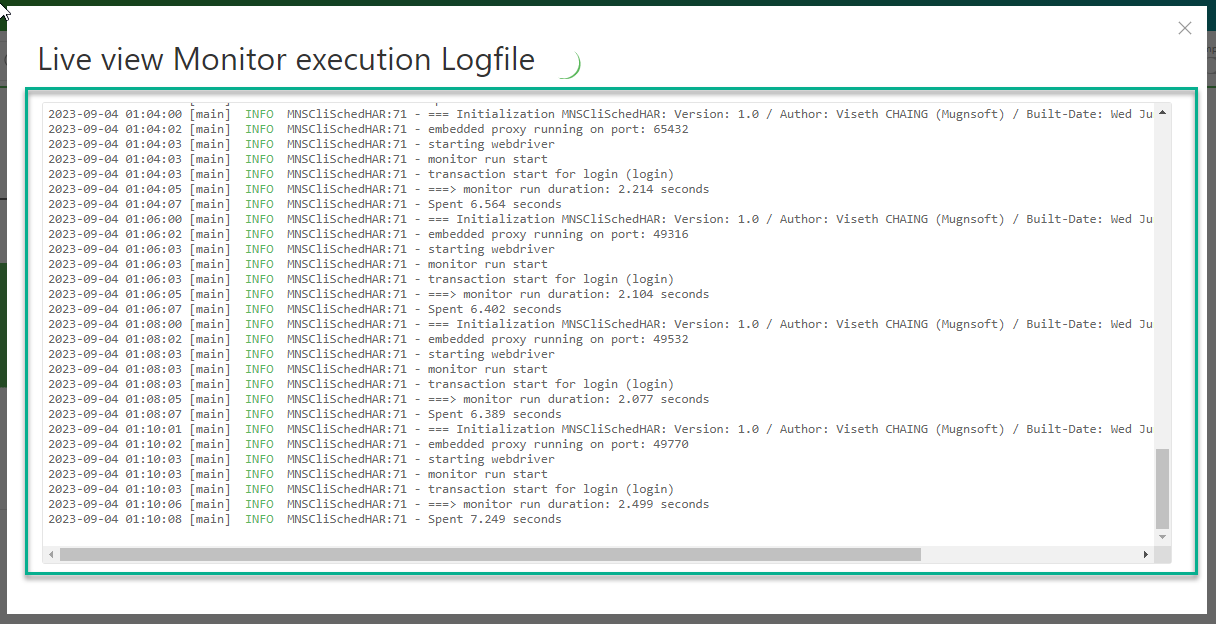
Live View
- hover on the monitor and click on the live view icon
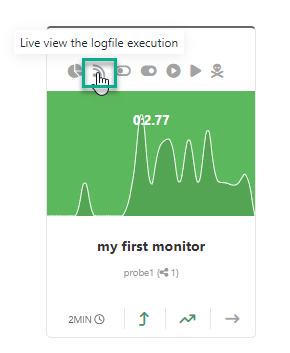
- the live view execution of the monitor is displayed in the modal windows
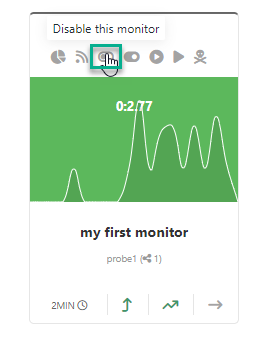
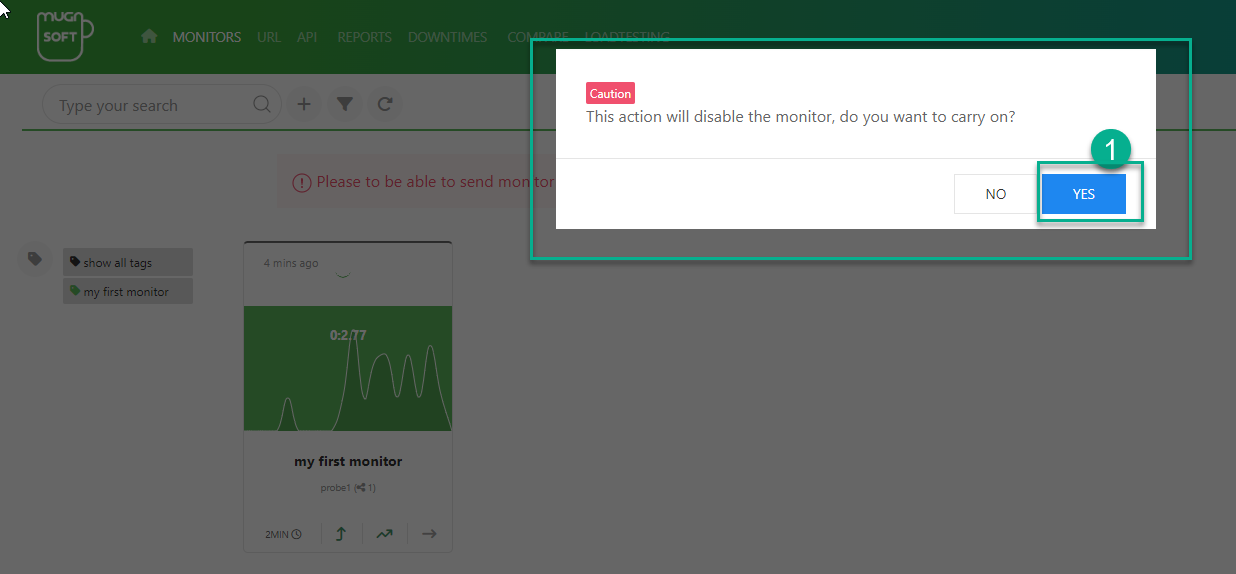
Disable monitor
- hover on the monitor and click on the disable icon
- an alert appears, click OK in a modal windows
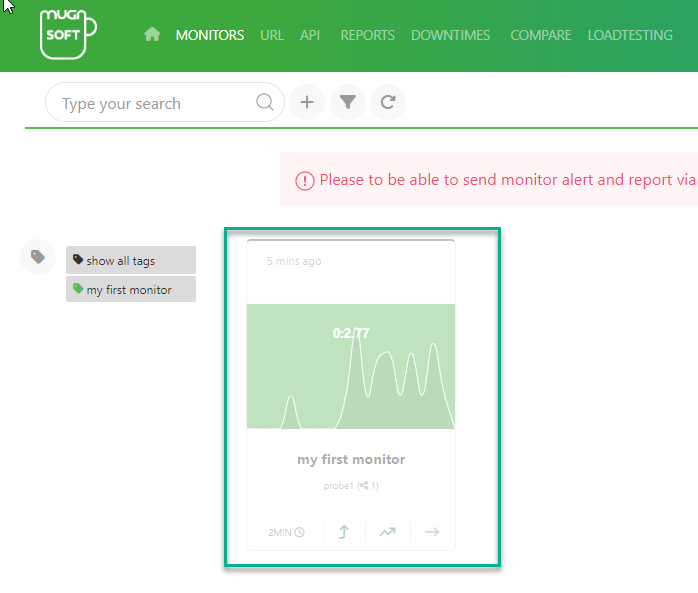
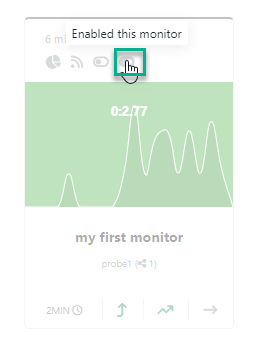
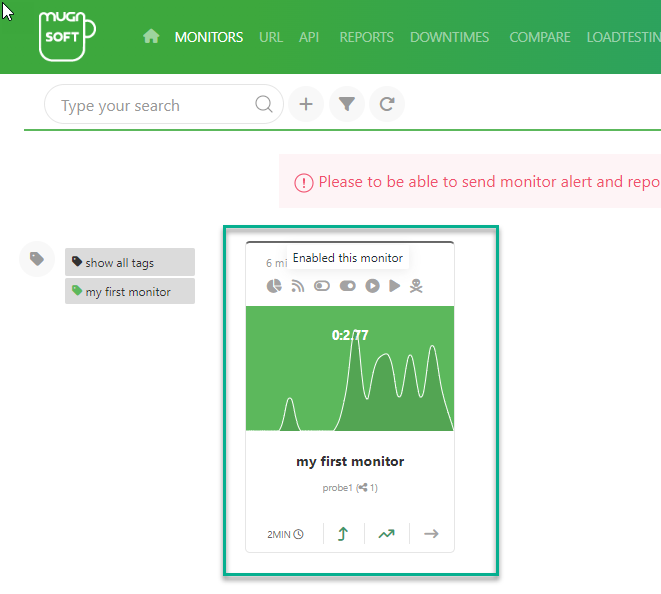
Enable monitor
- hover on the monitor and click on the enable icon
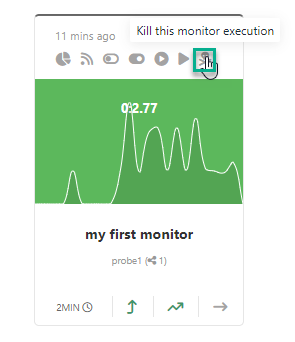
Kill a running monitor
- hover on the monitor and click on the kill icon
At the bottom right once the kill operation finishes, the status notification will show up.
- if the monitor was successfully killed:

- if the monitor is not currently running:

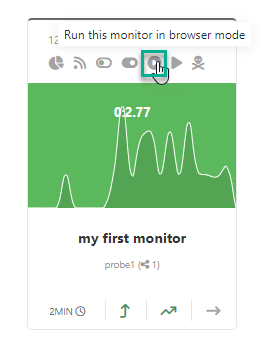
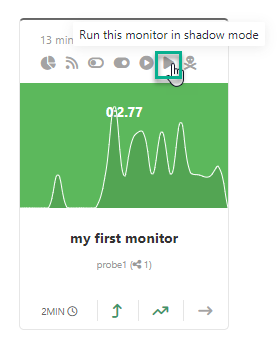
Run browser mode
When the monitor is run in browser mode, the execution will open the specified browser and you can will see the browser interaction with the website.
- hover on the monitor and click on the run browser mode icon
At the bottom right once the run finishes, the status notification will show up. Below are the possible status:
- if the monitor runs sucessfully:

- if the monitor runs into a error:

- if the monitor’s config is missing:

- if the monitor fails to start:

- if there is already a running instance of the monitor:

For status meaning, refer to the monitor statuses.
Run headless mode
When the monitor is run in headless mode, the execution will not open any browser and will run silently in the background.
- hover on the monitor and click on the run headless mode icon
At the bottom right once the run finishes, the status notification will show up. For status refer to the monitor statuses.
Monitor statuses
below are the status color code of monitor runs:

- overlap: this status means that there is already a running monitor. Wait after the monitor finishes to run the monitor.
- error: this status means that the monitor failed to run.
- config: this status means that the monitor’s config is missing on the probe.
- exception: this status occurs when the monitor failed to start.
- green color: this status means that the monitor successfully ran. The value inside is the time it took to run.
- yellow color: this status means that the monitor successfully ran but the minor threshold was crossed. The value inside is the time it took to run.
- orange color: this status means that the monitor successfully ran but the major threshold was crossed. The value inside is the time it took to run.
- red color: this status means that the monitor successfully ran but the critical threshold was crossed. The value inside is the time it took to run.
Delete monitor
- hover on the monitor and click on the delete icon
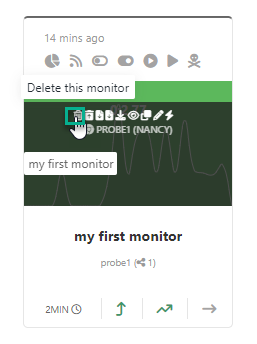
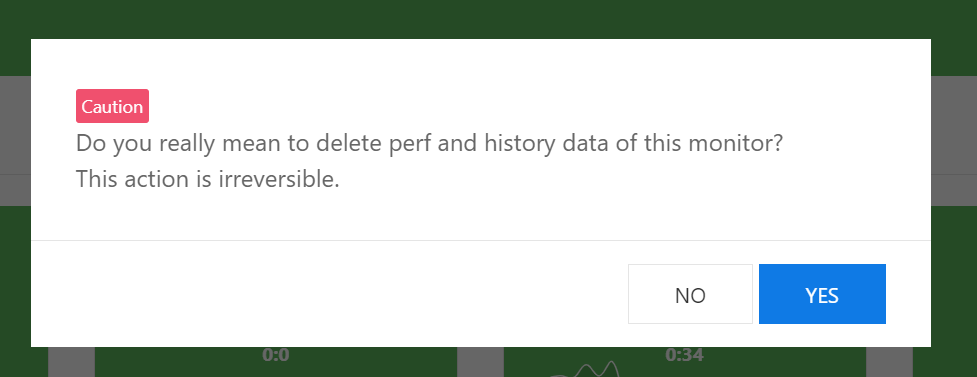
- answer yes to perform the deletion otherwise answer no
At the bottom right once the deletion finishes, the status notification will show up. Below are the possible status:
- if the monitor deletion was successful:

- if the monitor is use in a report or a downtime:

In the later case, you need to remove the monitor from those reports and/or downtimes. The monitor can be remove only when there is no reference to it in reports and/or downtimes.
Clean monitor
- hover on the monitor and click on the clean icon
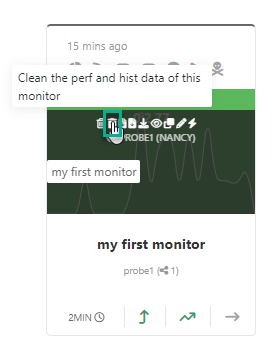
- answer yes to perform the cleaning otherwise answer no
At the bottom right, upon success you should see the below notification:
- monitor’s data should have been purged
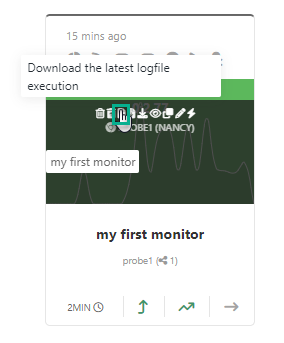
Last logfile monitor
- hover on the monitor and click on the download latest logfile icon
At the bottom right, upon success you should see the below notification:
Last HAR file
- hover on the monitor and click on the download HAR file icon

At the bottom right, upon success you should see the below notification:
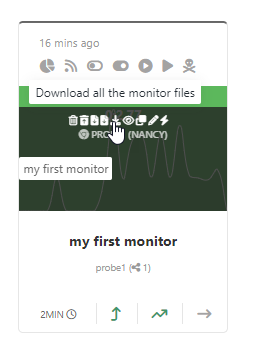
Download run files
- hover on the monitor and click on the download icon
At the bottom right, upon success you should see the below notification:

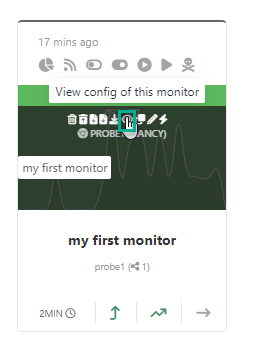
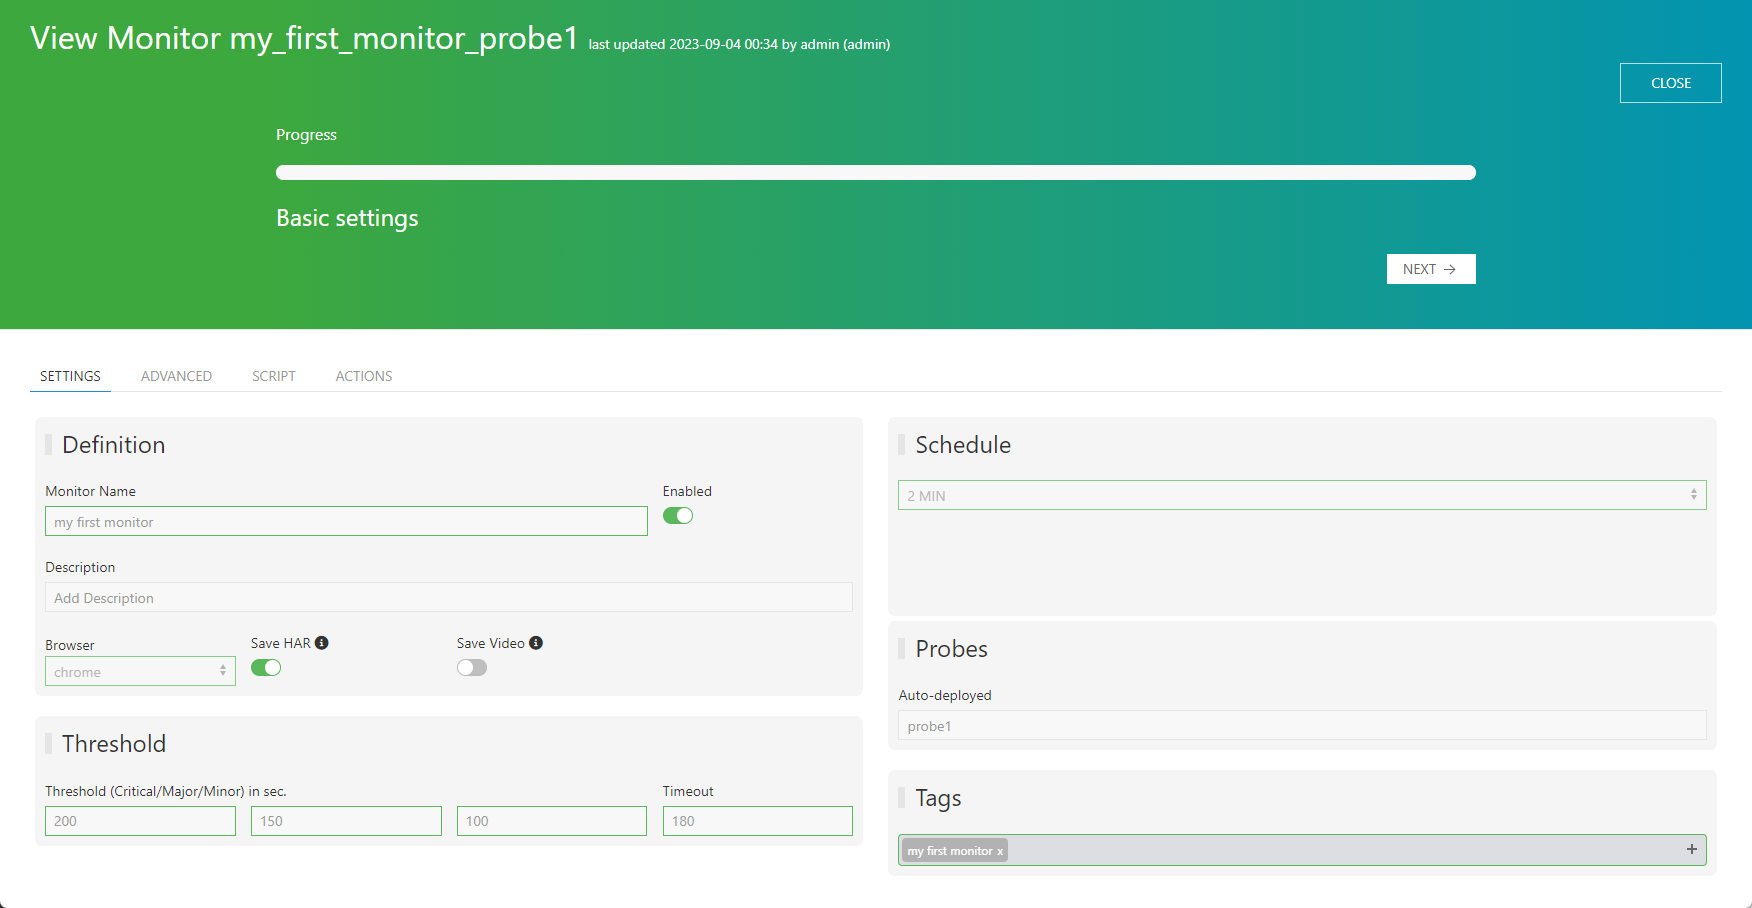
View monitor
- hover on the monitor and click on the view icon
- close the modal windows to return back to the monitors list page
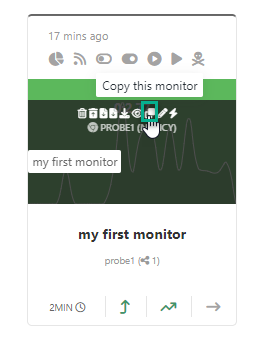
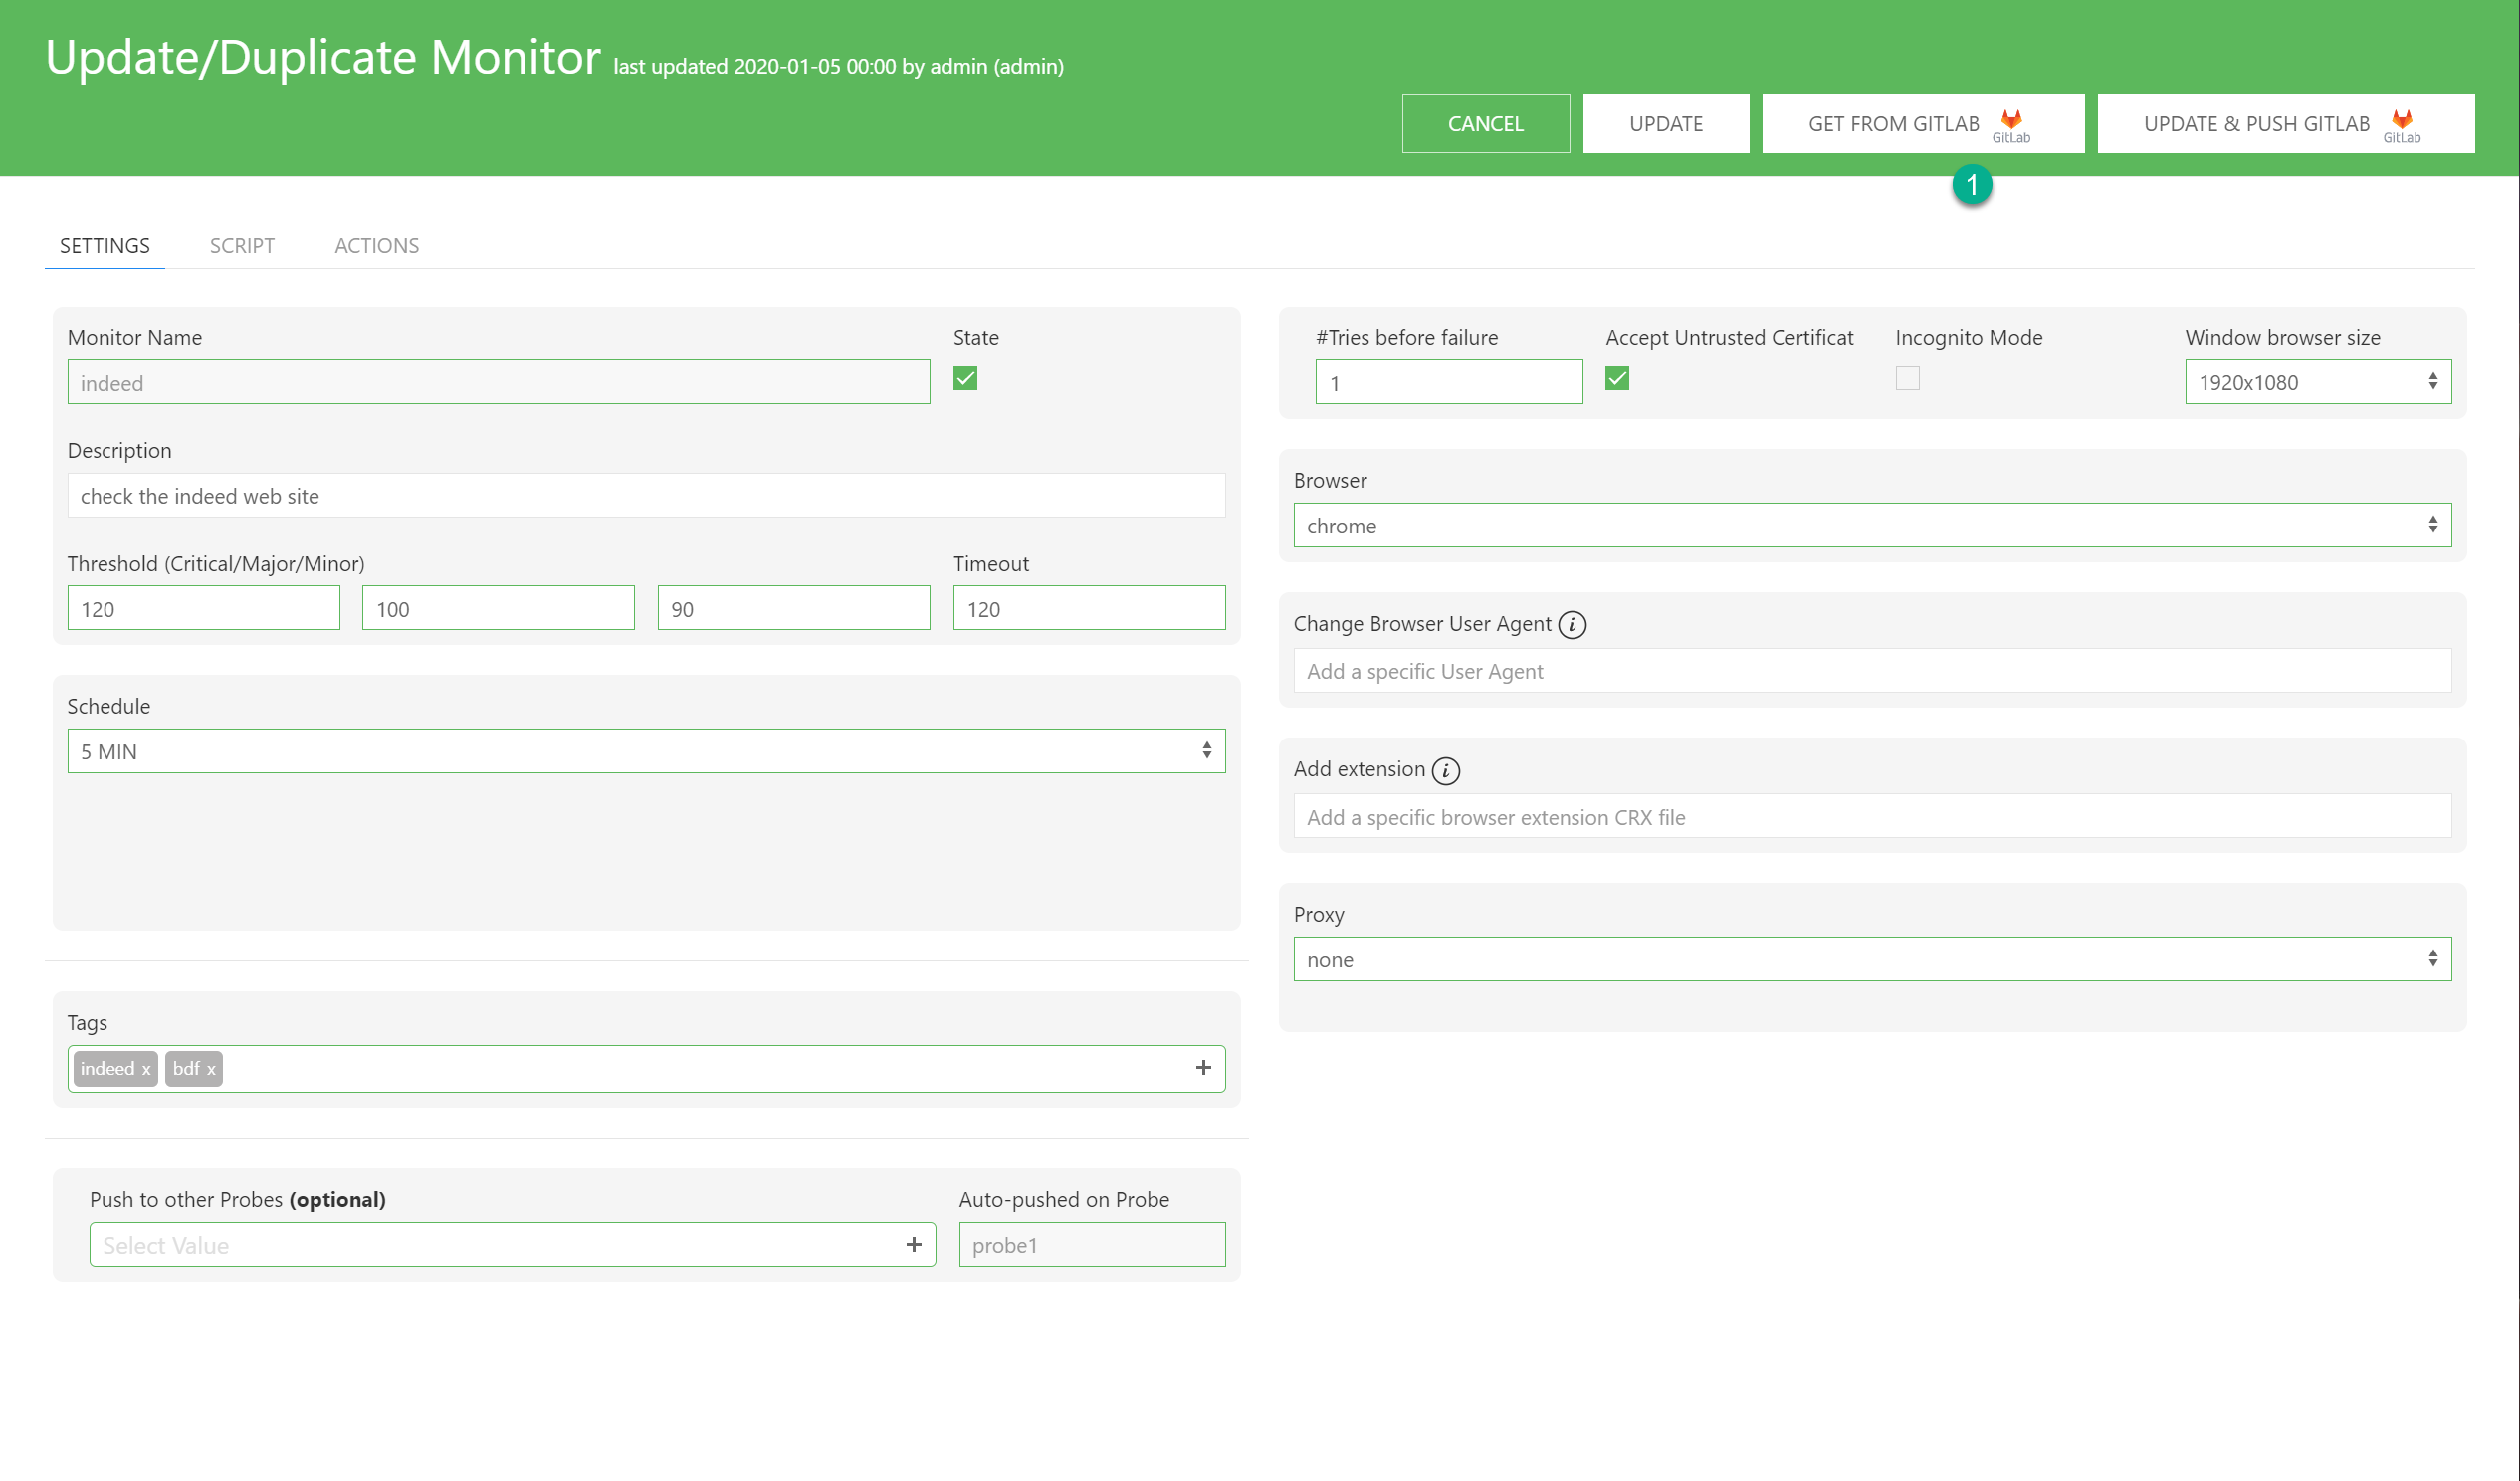
Duplicate monitor
- hover on the monitor and click on the duplicate icon
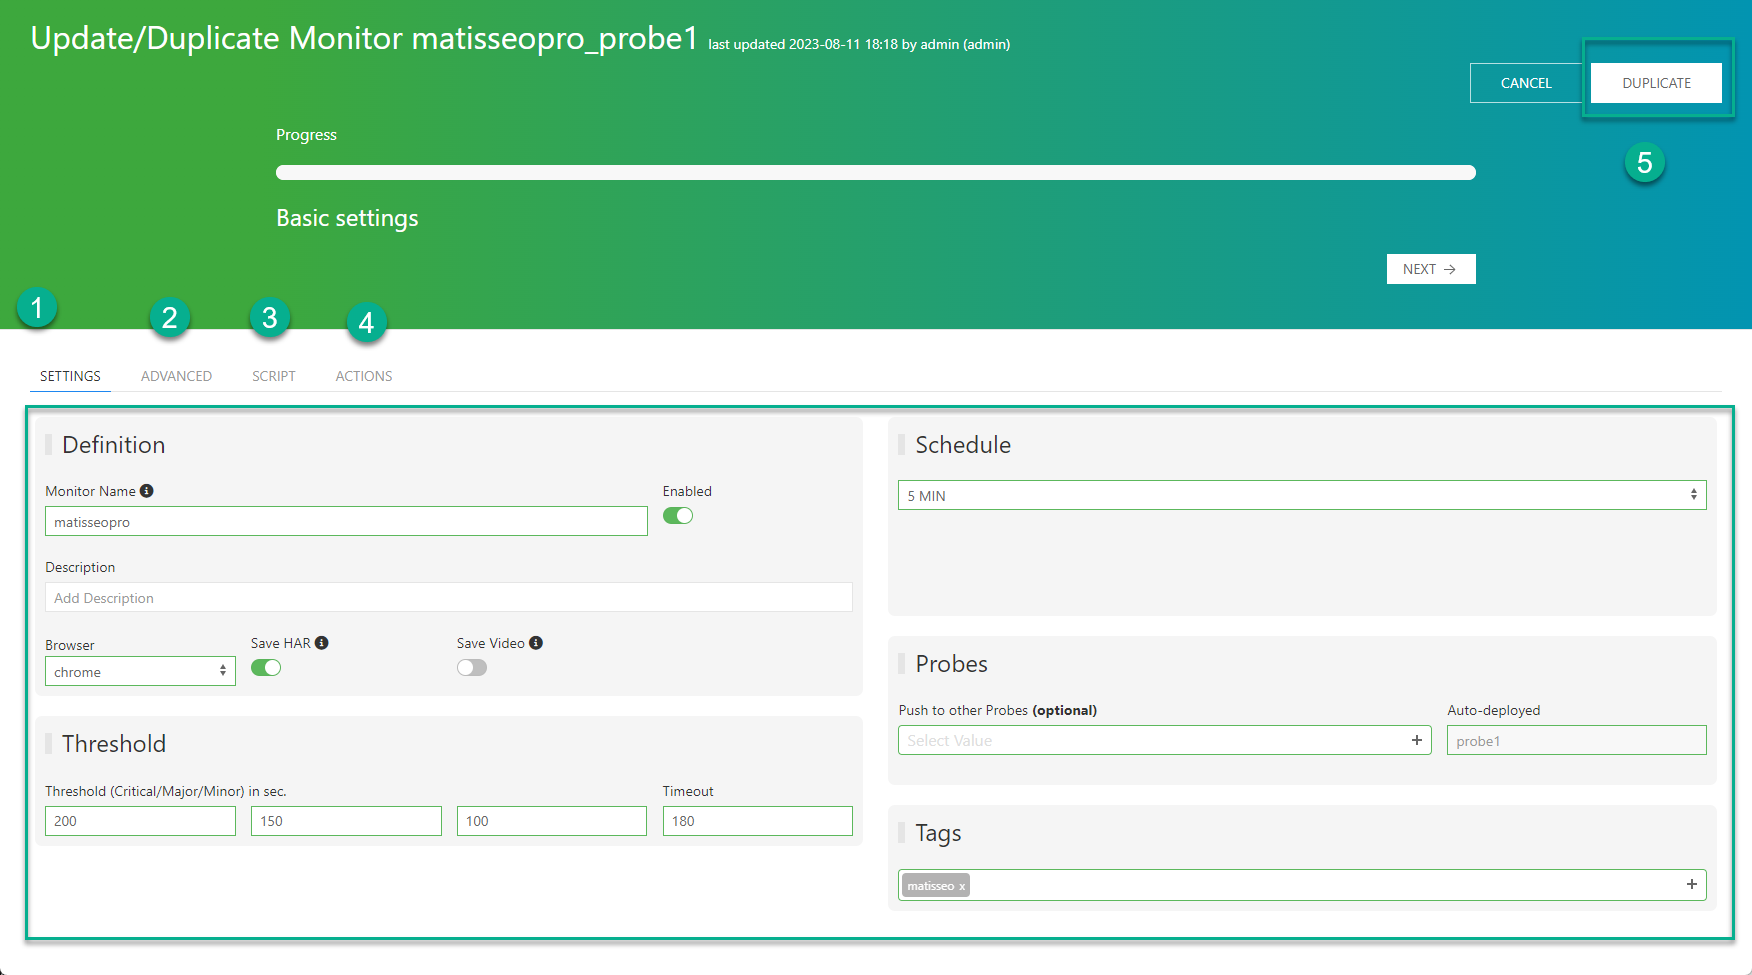
- update the monitor’s settings, script, actions for this duplicate instance, and click on the duplicate button
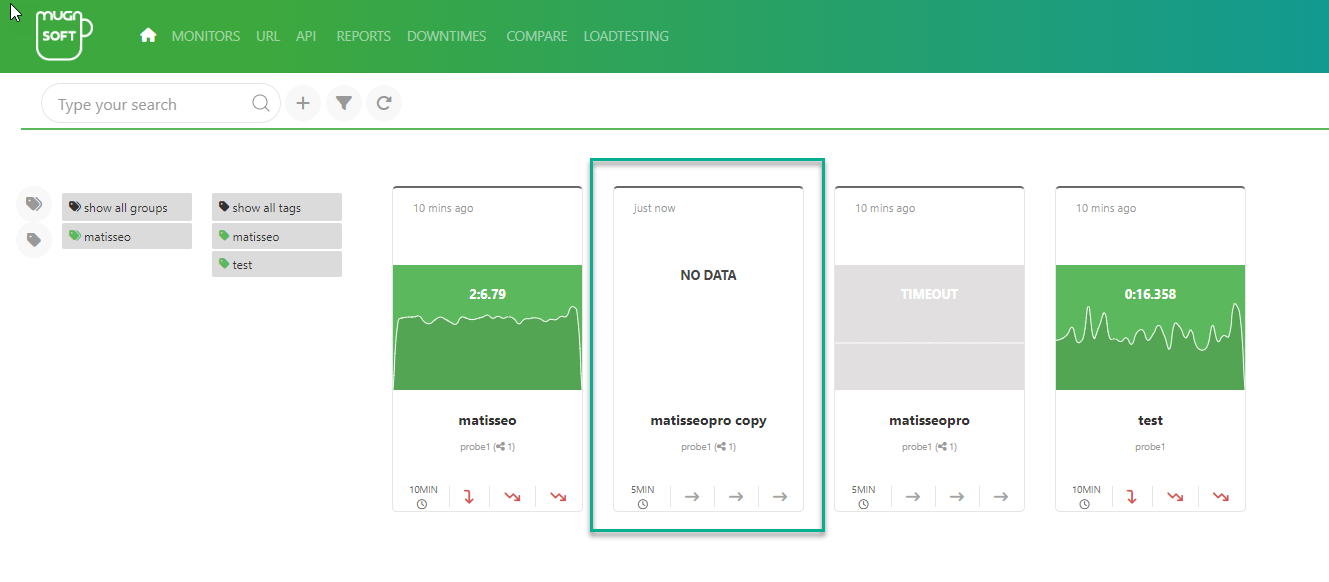
- the duplicated monitor should appear in the list
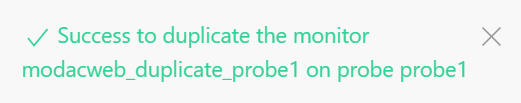
At the bottom right, upon success you should see the below notification:
Edit monitor
- hover on the monitor and click on the edit icon
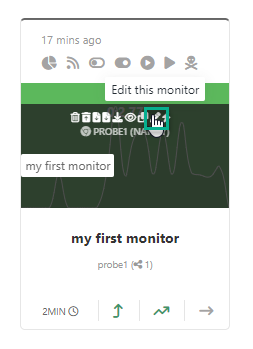
- update the monitor’s settings, script, actions for this instance, and click on the update button
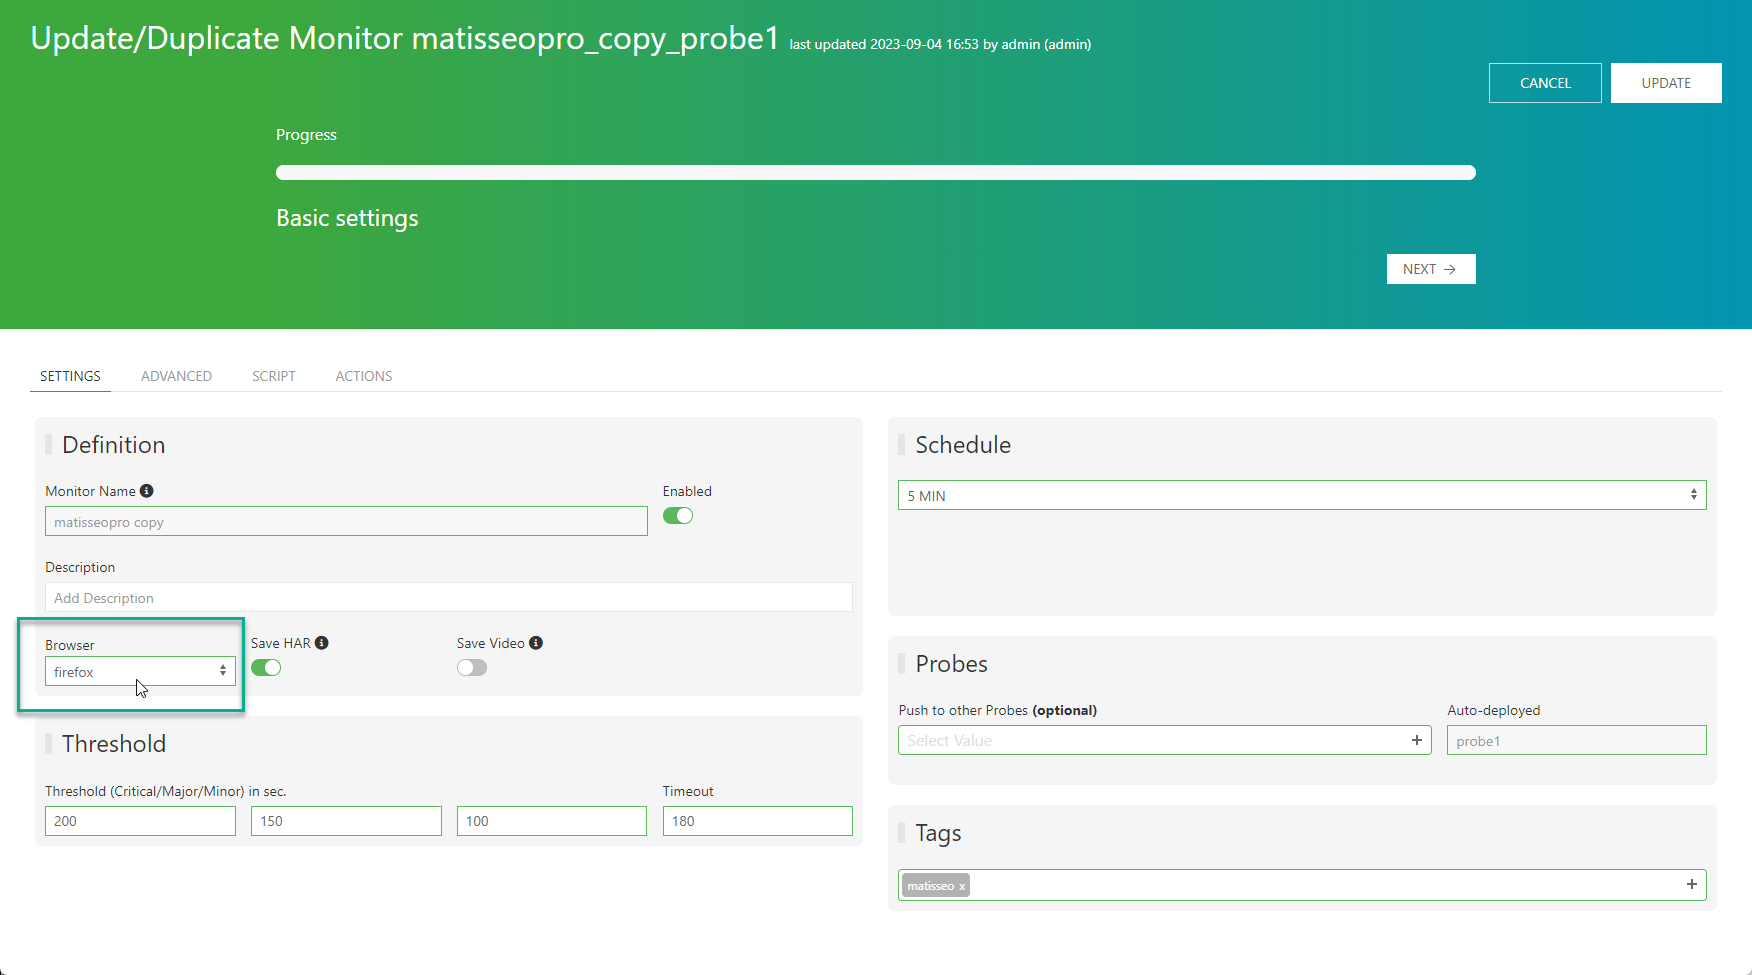
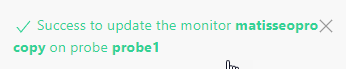
- the edited monitor should appear in the list
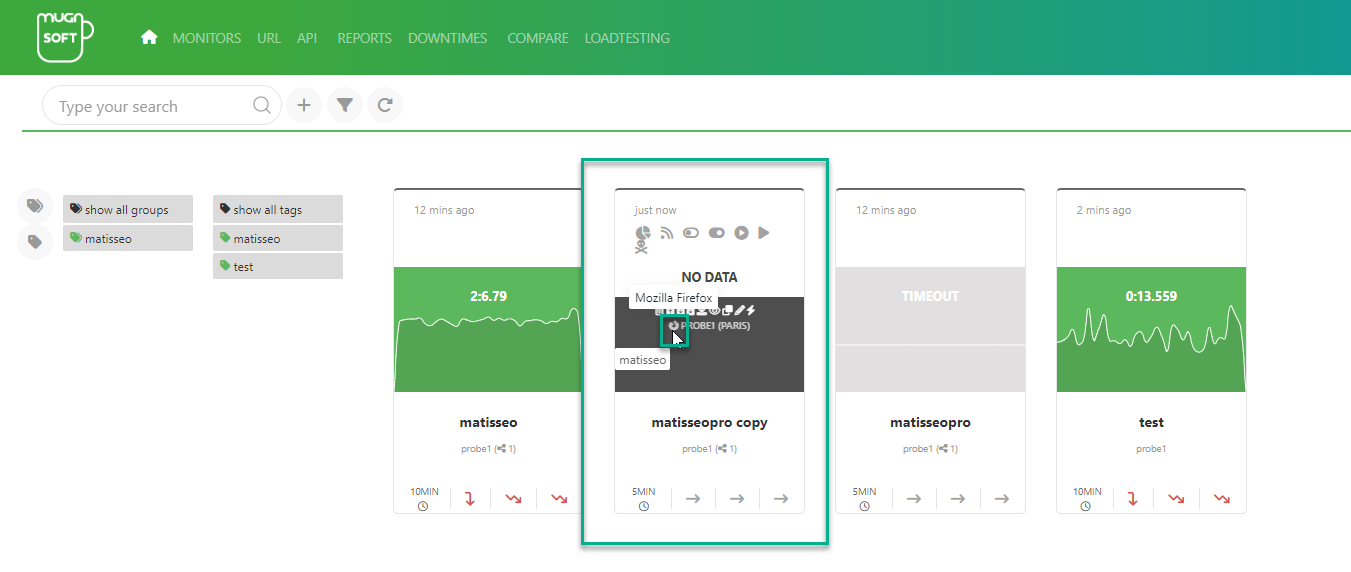
At the bottom right, upon success you should see the below notification:
Compute Threshold monitor
- hover on the monitor and click on the “compute this monitor thresholds” icon
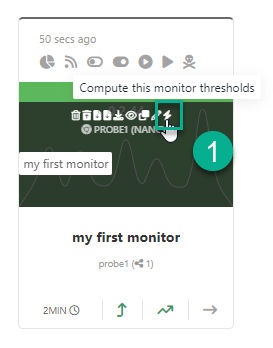
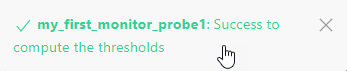
- upon completion the following alert message appears at the bottom right
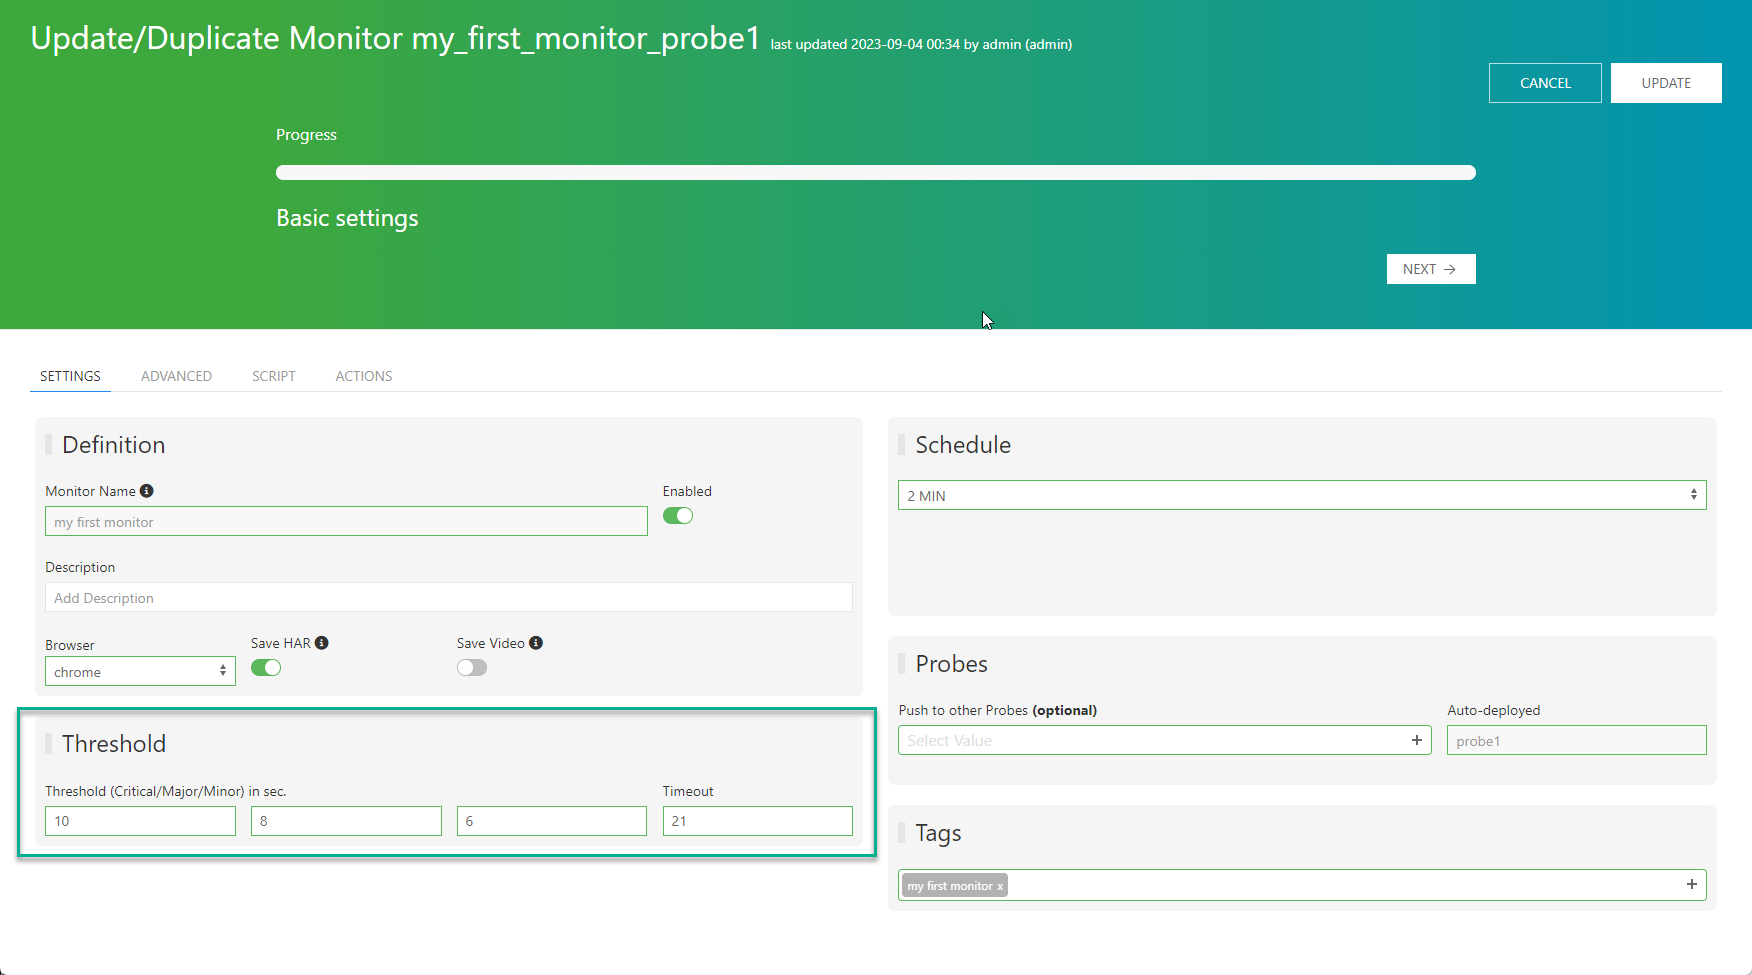
- the threshold of the given monitor should be updated
Choosing the method. The baseline can be computed two ways, selected per probe under Settings → Auto baselining → Method:
- sigma (default) —
mean + factor × stddev; the Critical / Major / Minor / Timeout (std factor) inputs apply. - percentile (robust) — thresholds taken from the response-time distribution (Critical / Major / Minor (pct), Timeout (pct) × factor with an absolute floor). Recommended for noisy latency; the floor removes the false-outage timeout when traffic is very stable.
Selecting the method swaps which inputs are shown. The same section has Debounce status-change alerts — when on, a status-change notification only fires after the new status holds for notifyAfter+1 consecutive runs, suppressing single-spike flapping. See Monitor Configuration → Auto-Thresholding for the formulas and all parameters.
Pattern groups (URL & API)
URL and API monitors can grade the response body, not just the response time. Each pattern group extracts one value with a regexp and checks it against its own Minor / Major / Critical thresholds; the monitor status is the most severe of every group and the response time.
The Pattern groups grid appears in the Specific section of a URL or API monitor form. Its first row is the primary group; use + Add pattern group for more.
- In the regexp (capture group) cell of the first (primary) row, enter your pattern:
- Without a
(capture group)it is a plain content match — the response body must simply contain the pattern (otherwise the monitor fails). The operator and threshold cells collapse into a “content match” note; response-time thresholds still apply. - With one
(capture group)— e.g."length"\s*:\s*(\d+)— the captured text becomes a value to grade, and the operator + threshold cells appear.
- Without a
- Pick an operator:
number > / < / ==,string == / != / contains / not contains, ordatetime older than. - Fill the minor / major / critical thresholds. Leave a tier blank to ignore it — a group can define only Critical, for example.
- Optionally set a match index (
idx): which occurrence of the pattern to read.1is the first; bump it to reach element N of a repeated field or a JSON array (2= second item). - Use the checkbox at the start of each row to enable / disable a group — a disabled group is kept but not evaluated.
key: value and <tag>value</tag> — and proposes a name, regexp, match index and operator for each detected value, previewing what each one captures. Review, edit or untick rows, then Apply selected; the groups are added with blank thresholds for you to fill.
Click Add / Update to save. Removing or renaming a group also clears its old history on save. For the stored field format (patterns JSON, operators, datetimeFmt/datetimeTz) see Monitor Configuration → Pattern Groups.
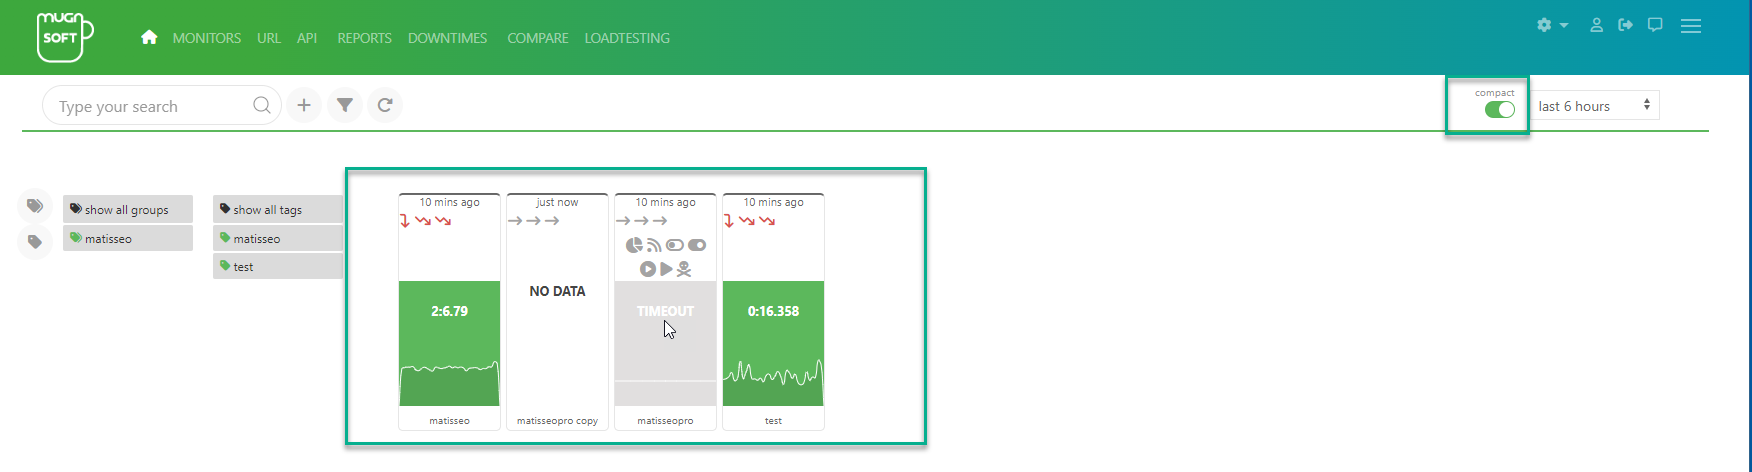
Toggle compact view
- click on the checkbox to display a compact view
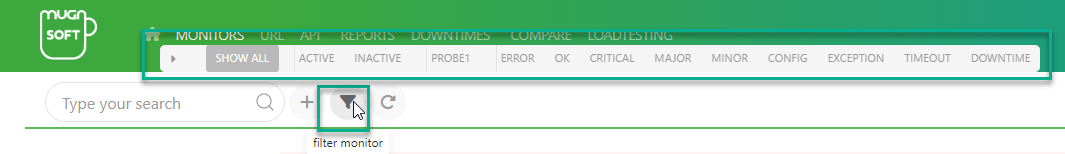
Filter monitor
We can filter monitors based on their state (enabled/disabled) or their name.
- Click on the given button to toggle the filter
- Click on any of these value to filter based on the state
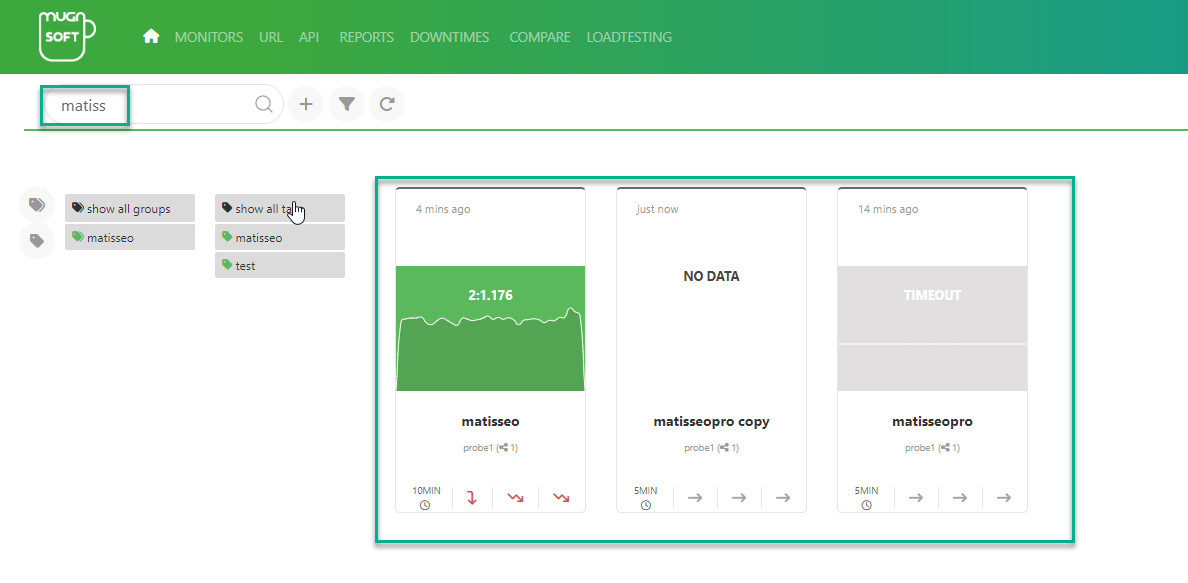
- Type in case sensitive pattern (part of the monitor name, tag, monitor) and type enter
- Type in “moda” and type enter
- Downtimes matching this criteria should appears in the list
Mugnsoft Gitlab integration
GitLab is a web-based DevOps lifecycle tool that provides a Git-repository manager providing wiki, issue-tracking and continuous integration and deployment pipeline[8] features, using an open-source license, developed by GitLab Inc.
To be able to perform these Gitlab operations, you need to configure first Mugnsoft Gitlab access. Here’s how to
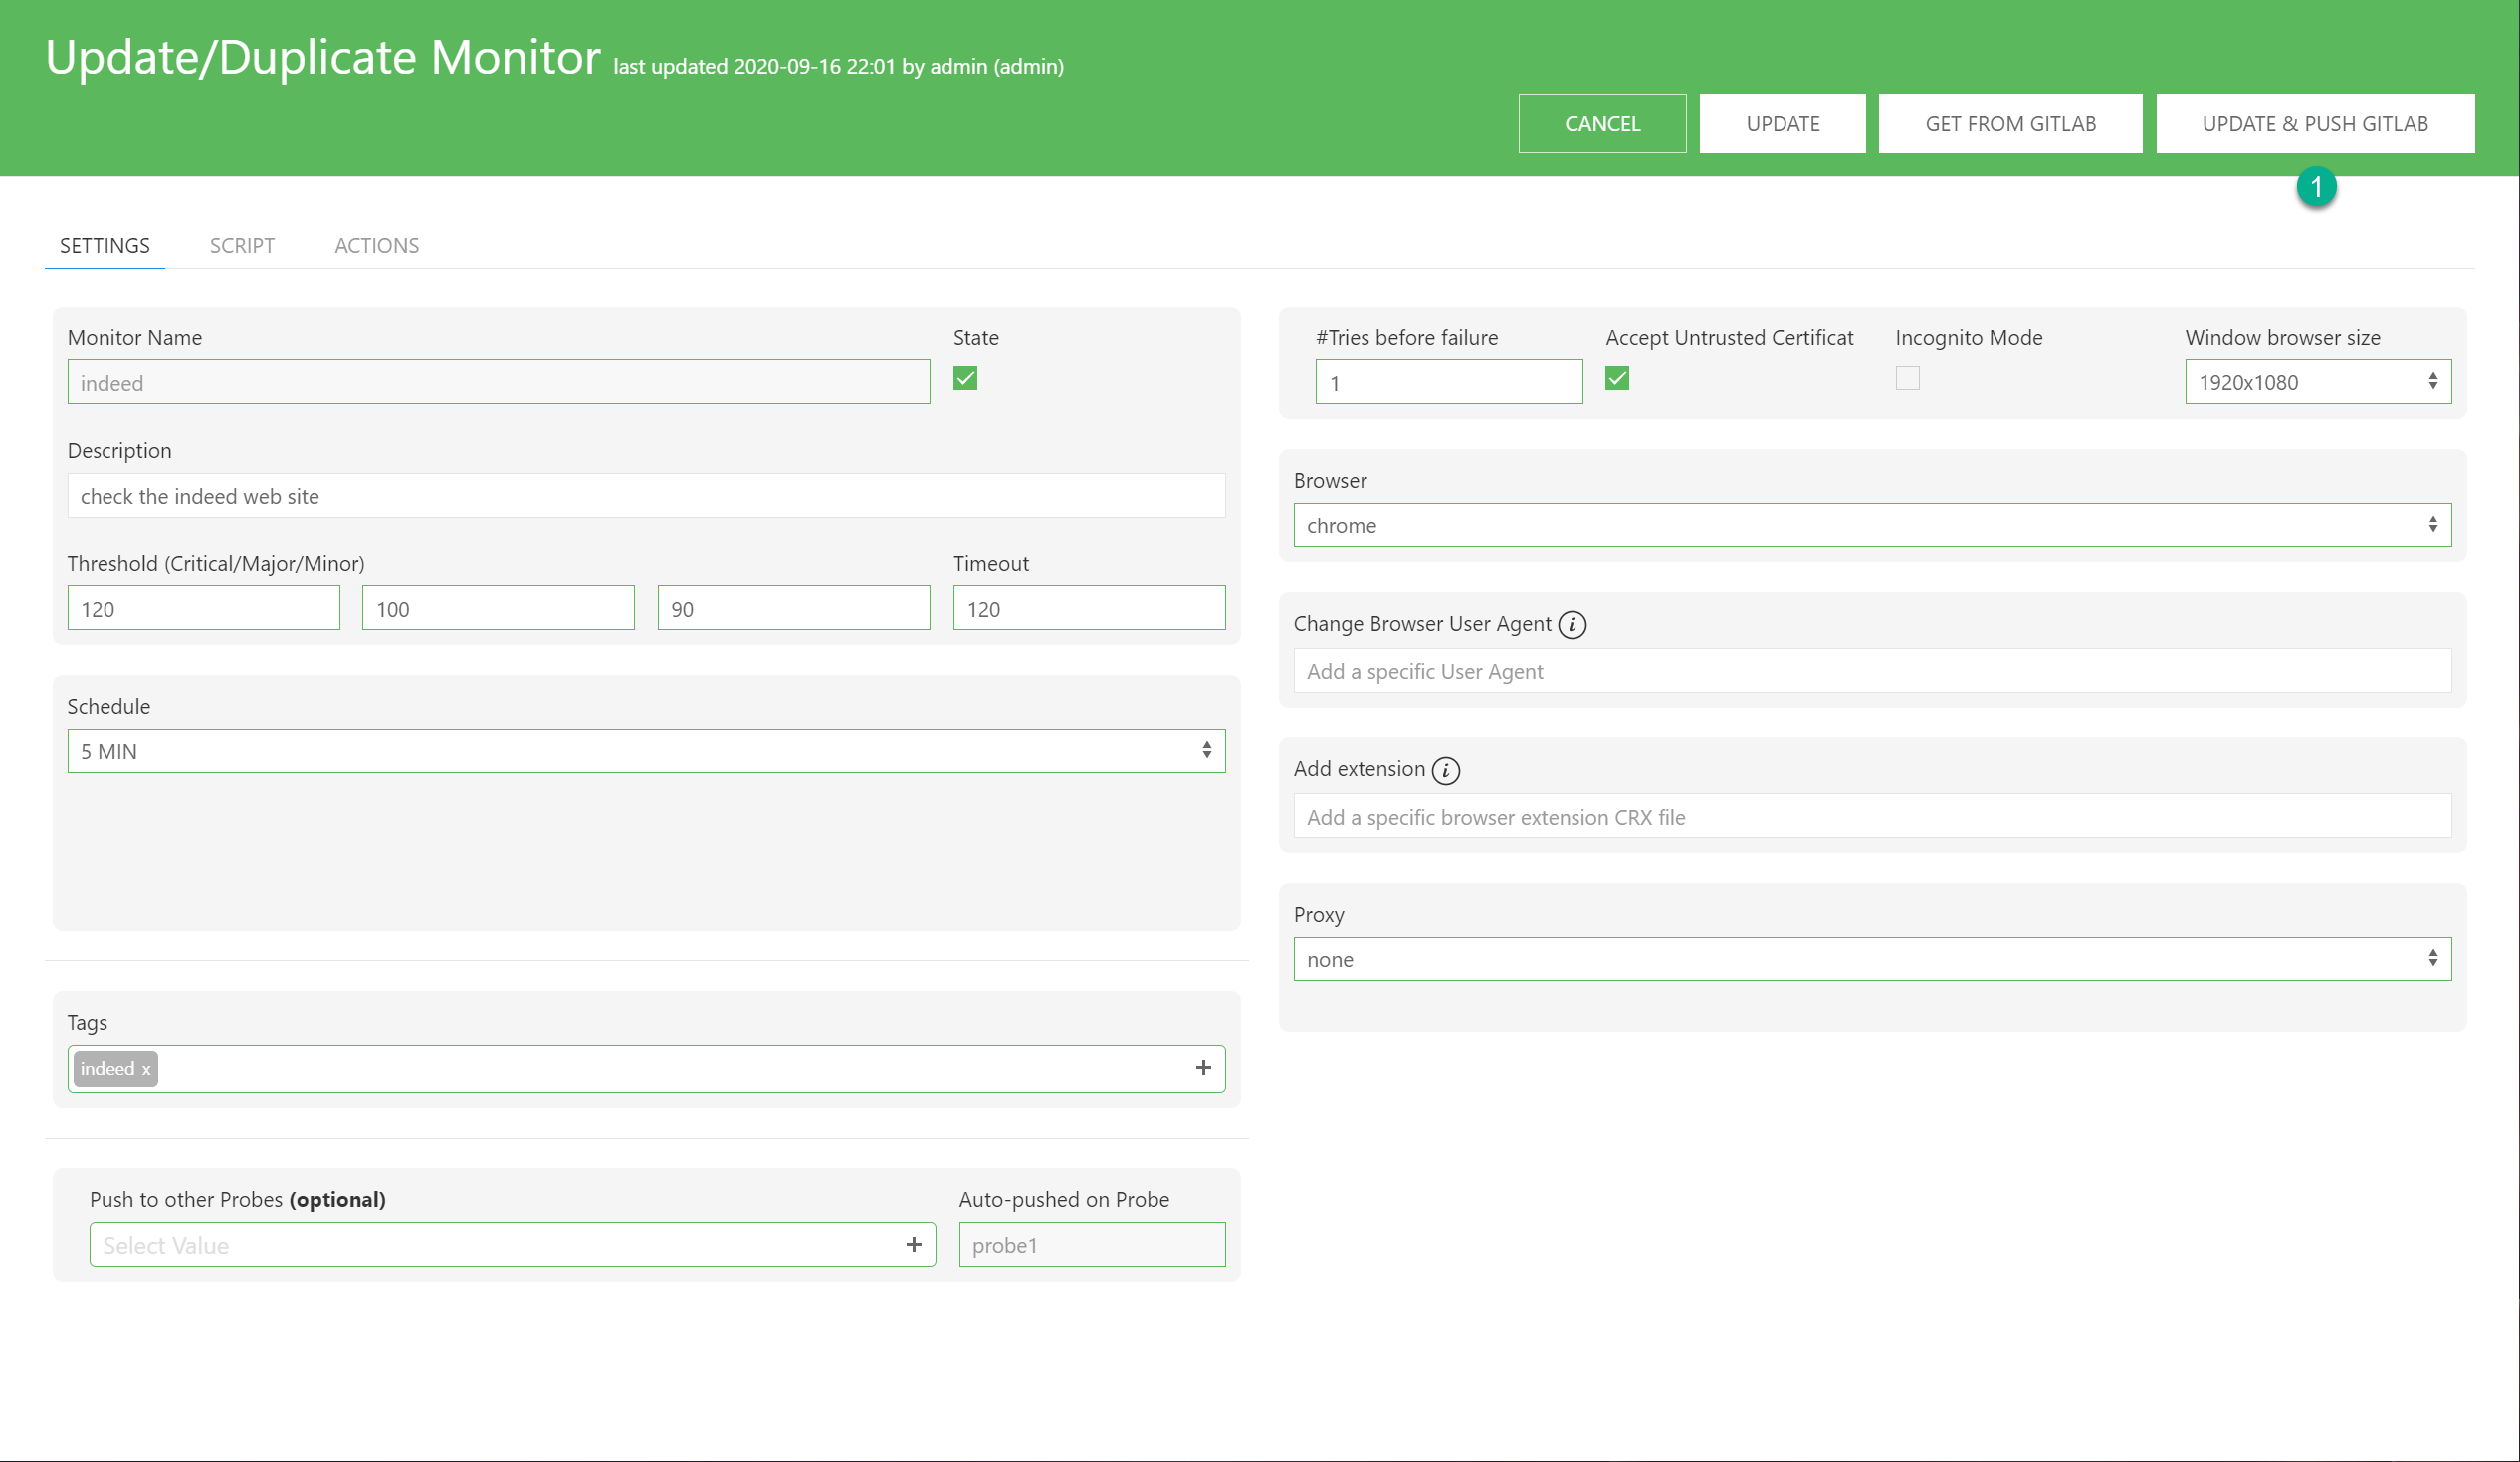
Update to Gitlab
We will demonstrate below how to save the monitor’s data (settings and script) in your Gitlab infrastructure.
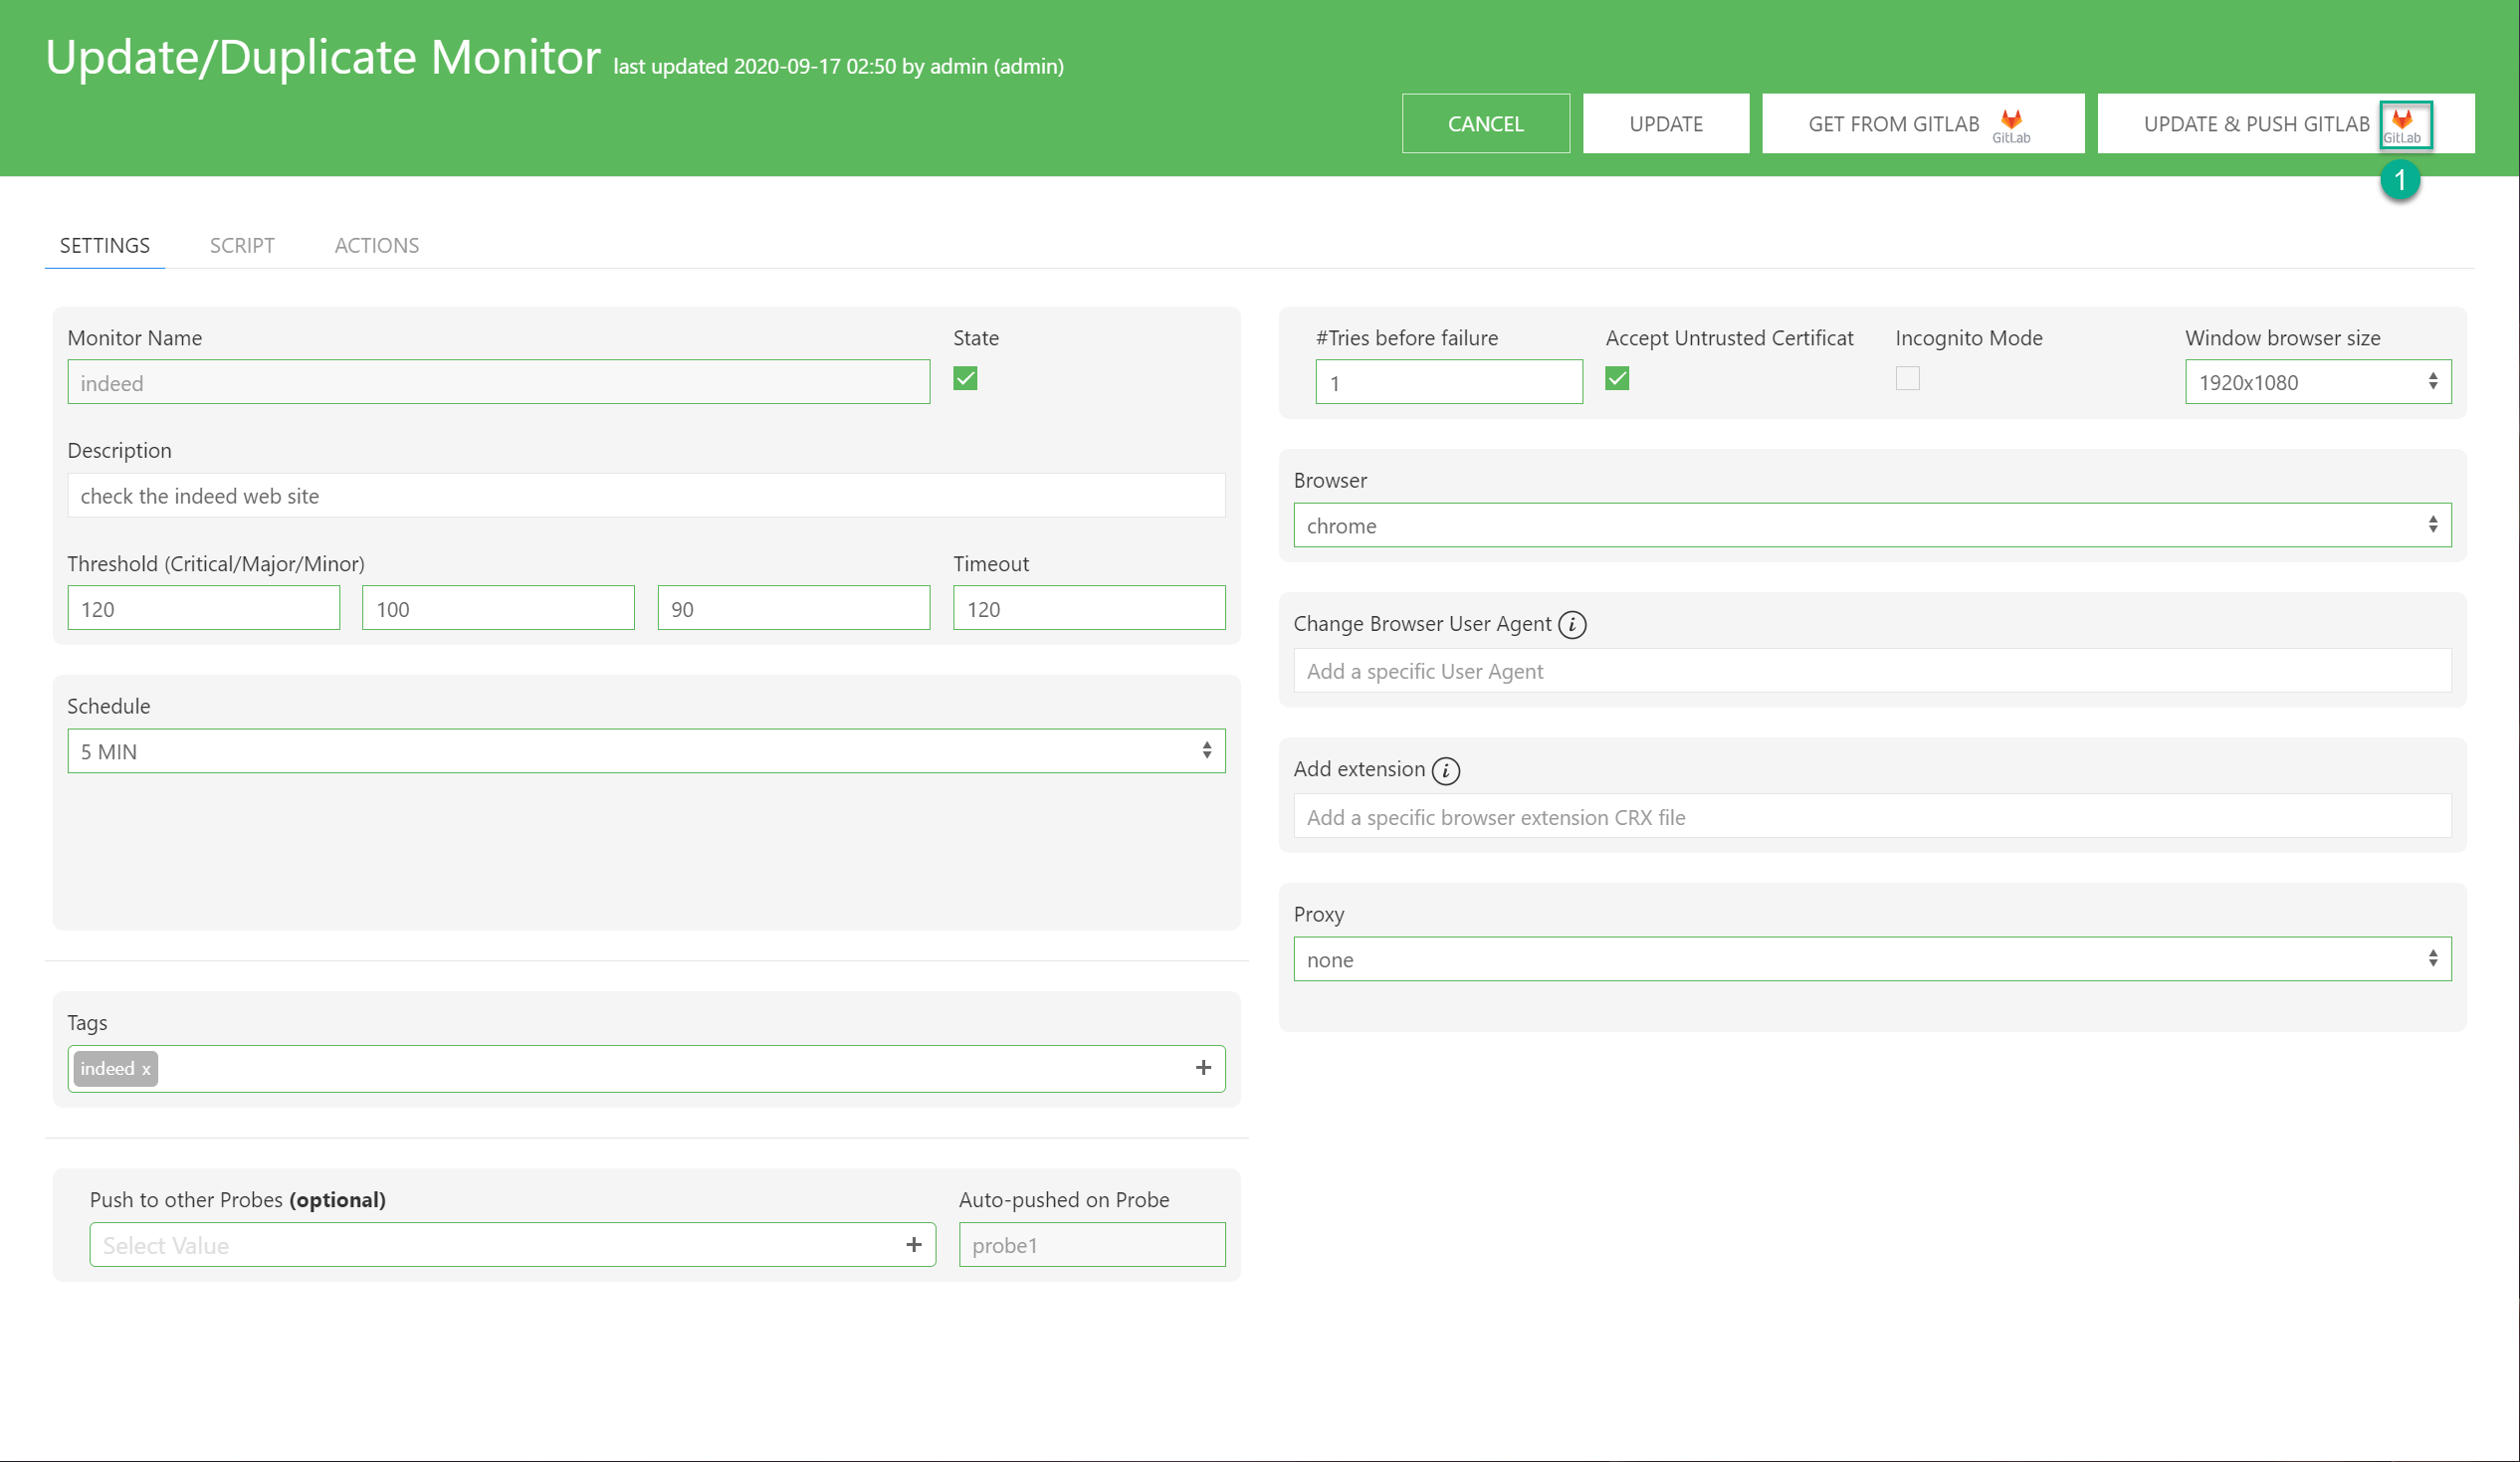
- hover on the monitor and click on the edit icon
- Click on the “Update & push Gitlab” button
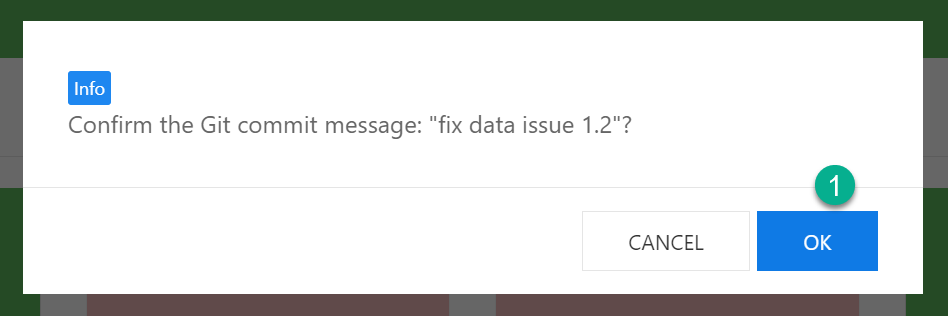
- Enter a Gitlab commit message
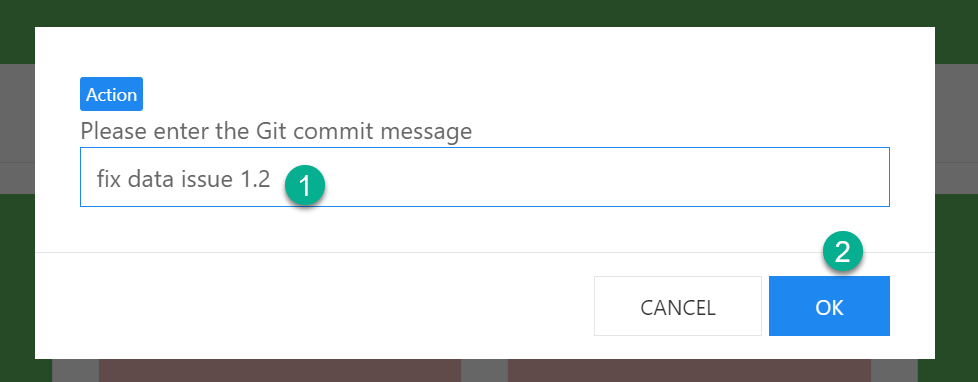
- Confirm to proceed otherwise cancel
At the bottom right, upon success you should see the below notification:
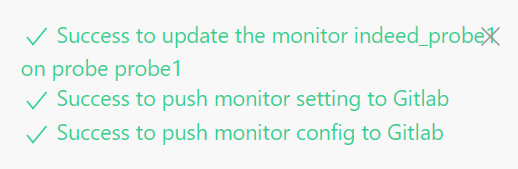
- If you view/edit the monitor, you will notice the Gitlab logo
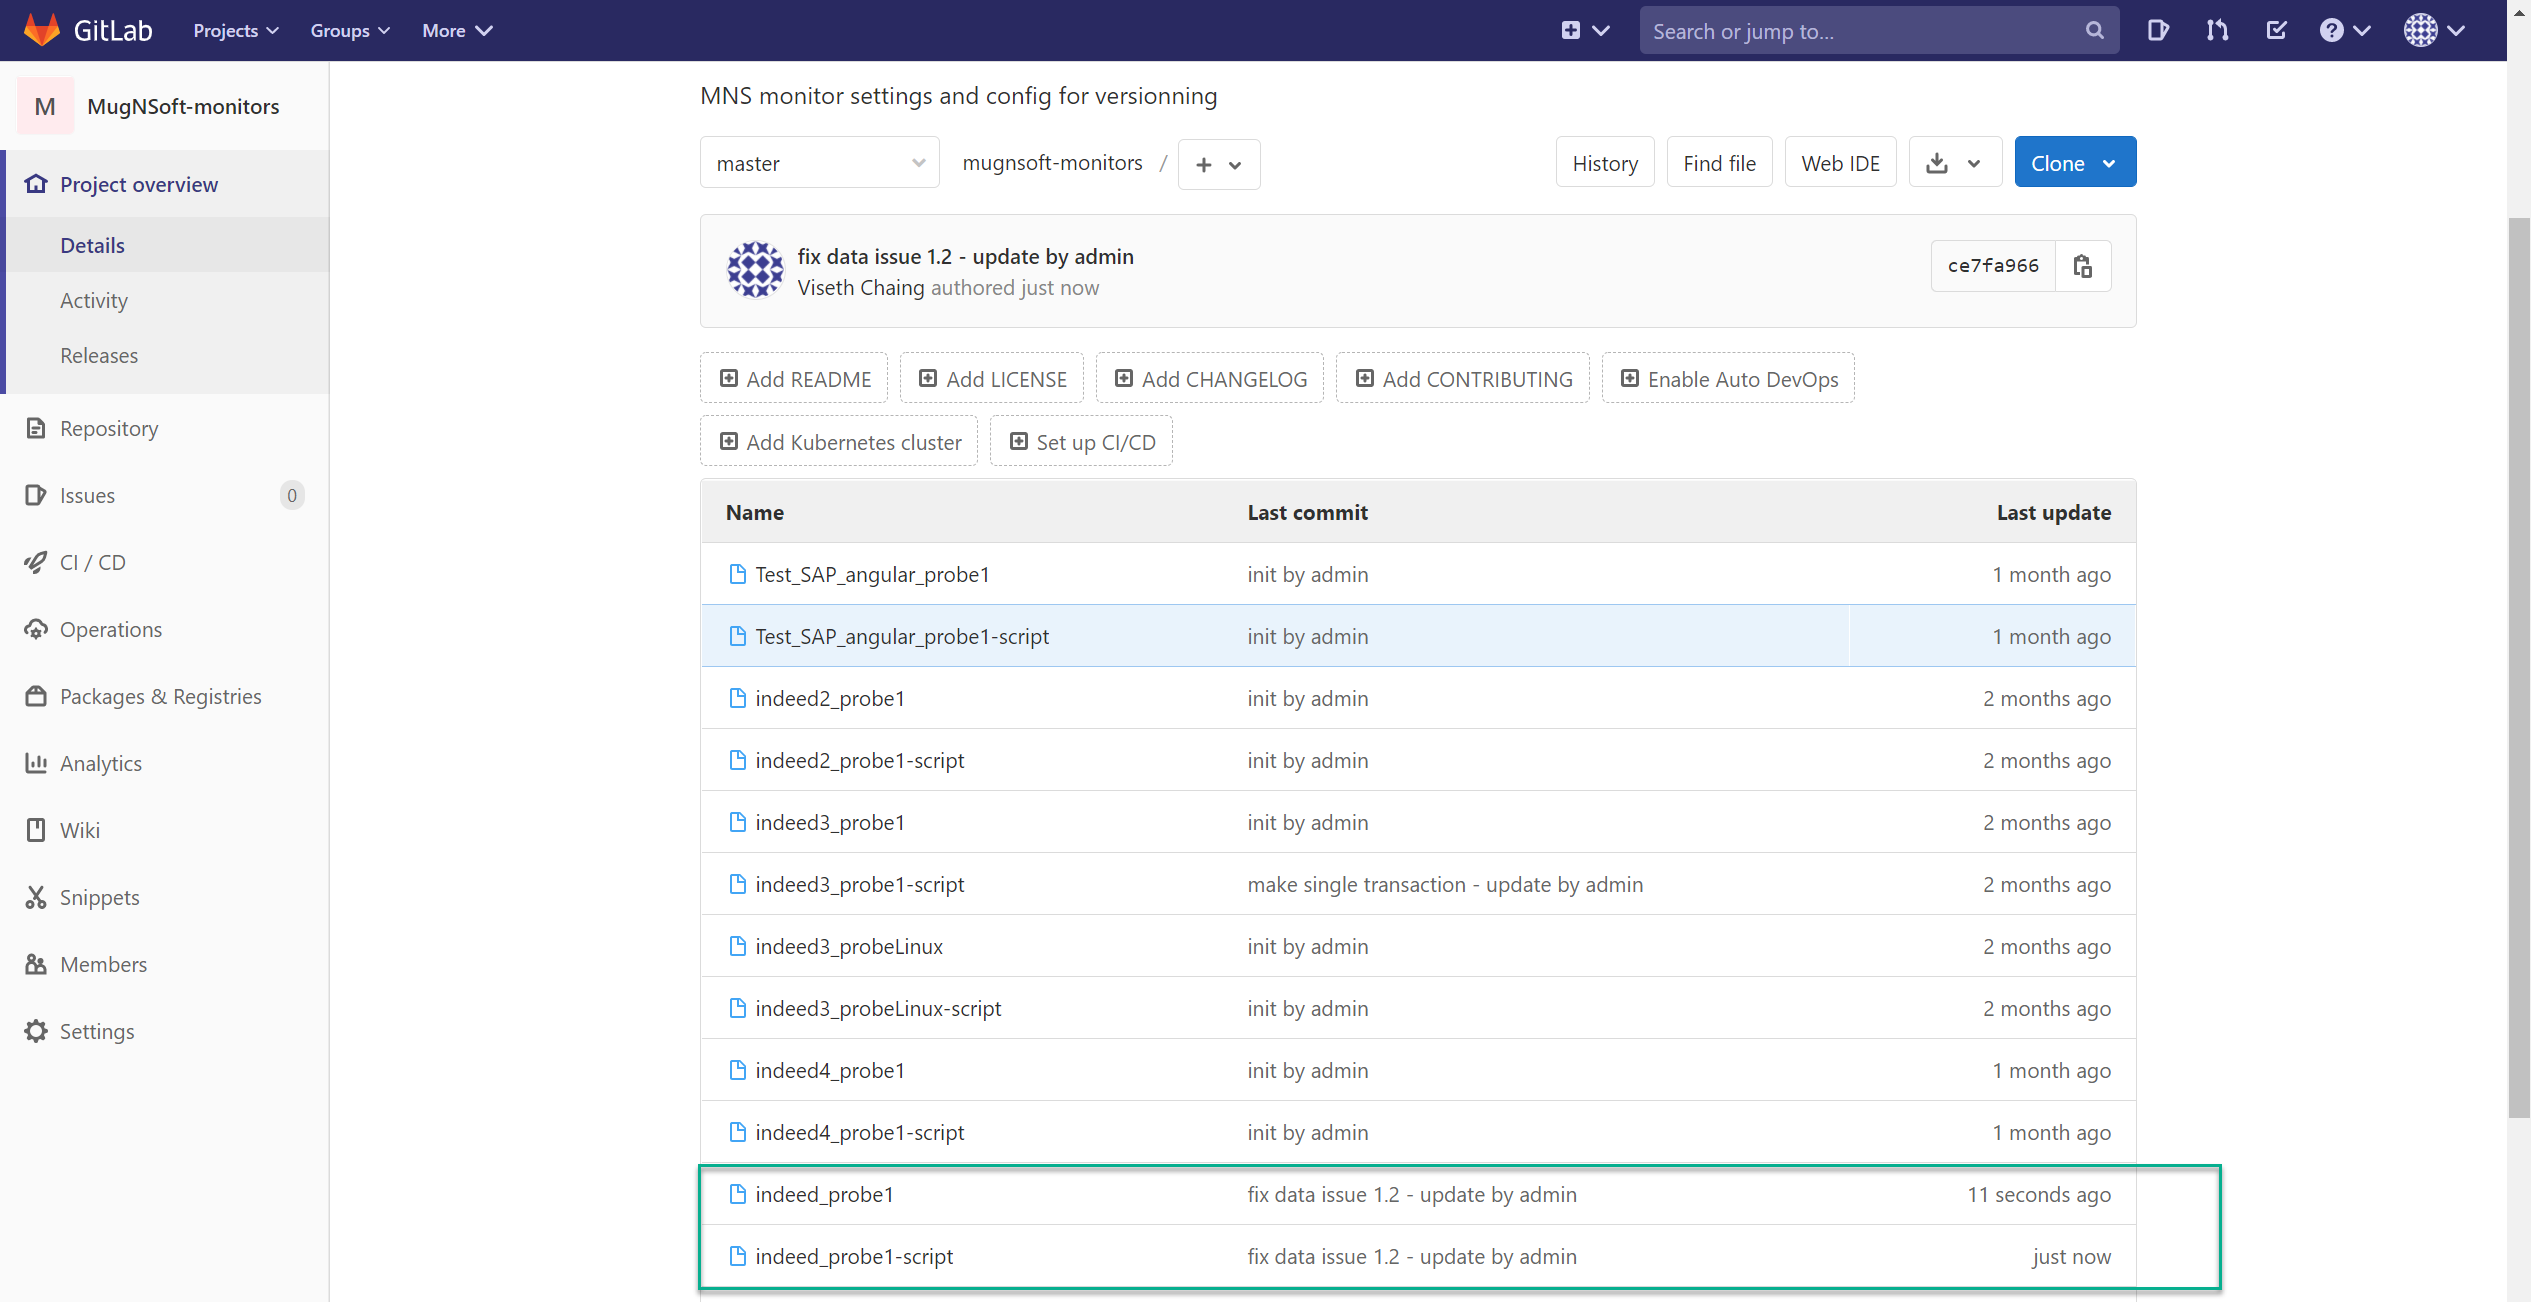
- Check you Gitlab repository, the commit message should be there along the Mugnsoft user that performed the commit
Get from Gitlab
You can fetch the latest commited version of your monitor’s data from Gitlab
- hover on the monitor and click on the edit icon
- Check whether the “Get from Gitlab” button as the Gitlab logo on it, if this the case that means the version you’re editing is the latest committed one on Gitlab
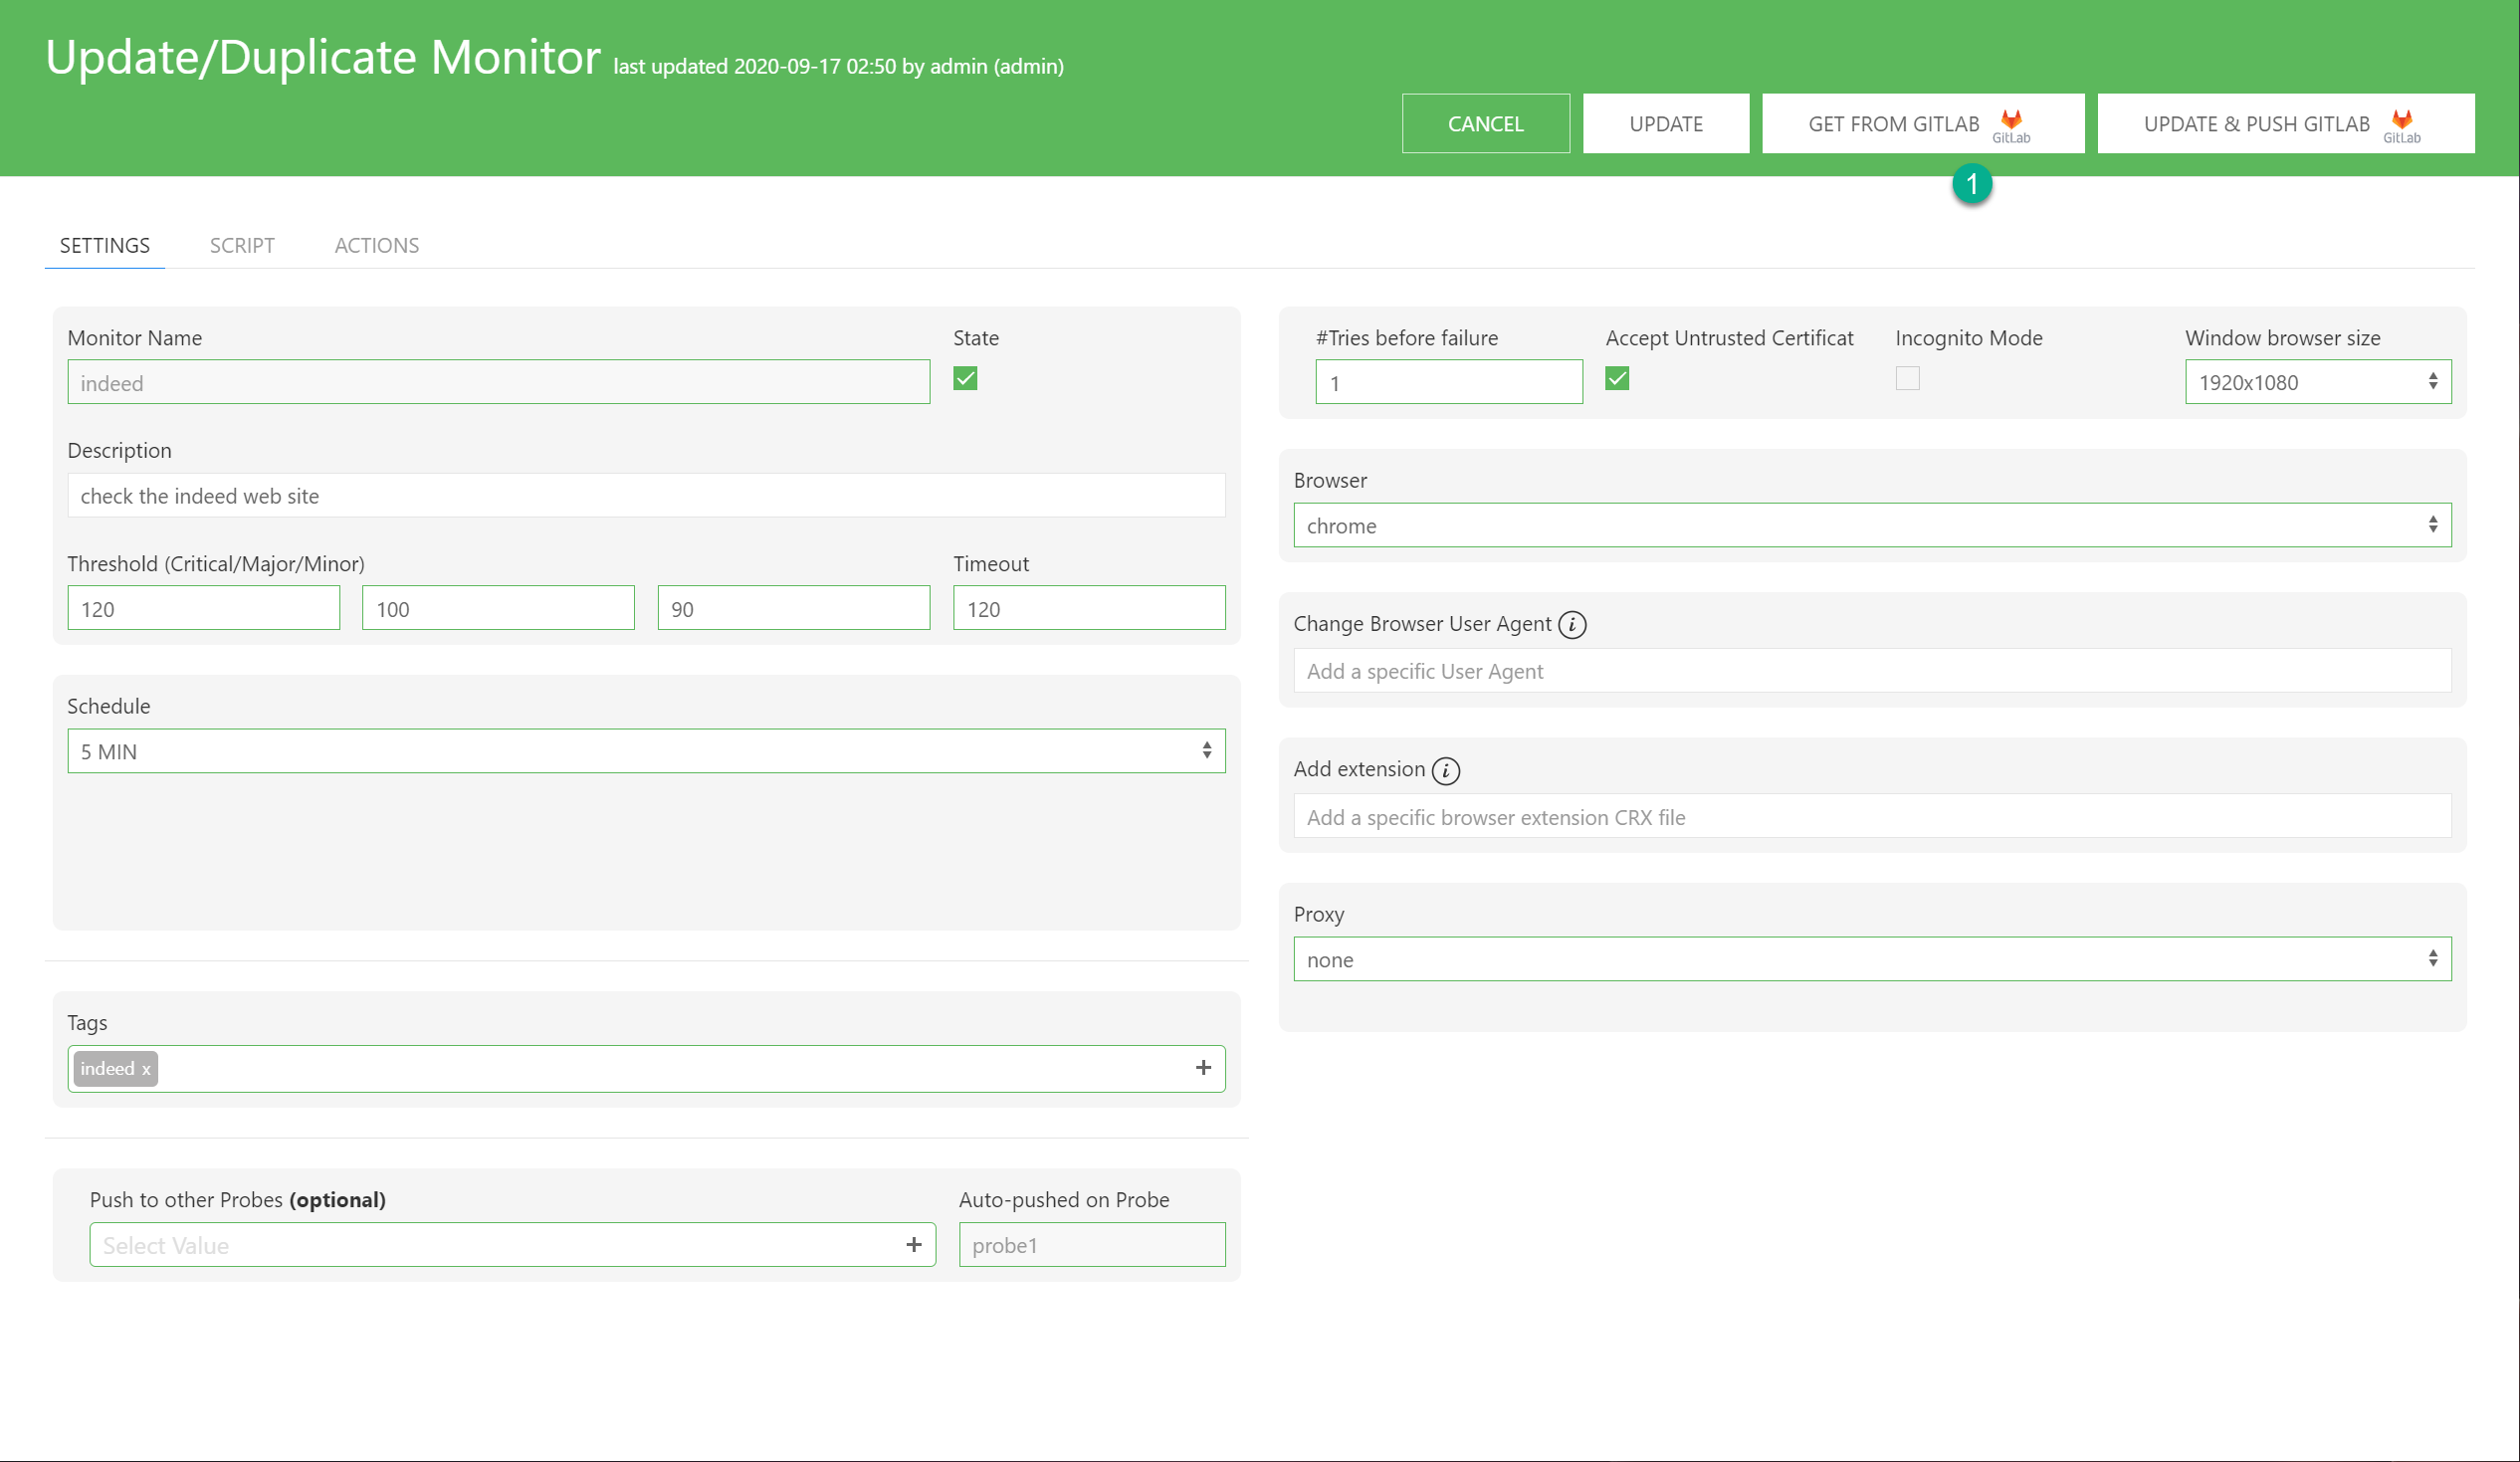
- Now assume that you have updated the monitor’s setting and/or the monitor’s script, but it was a wrongly move. If you wish to get the latest committed version from Gitlab and override the latest changes on this monitor. You simply have to click on the “Get from Gitlab” button.
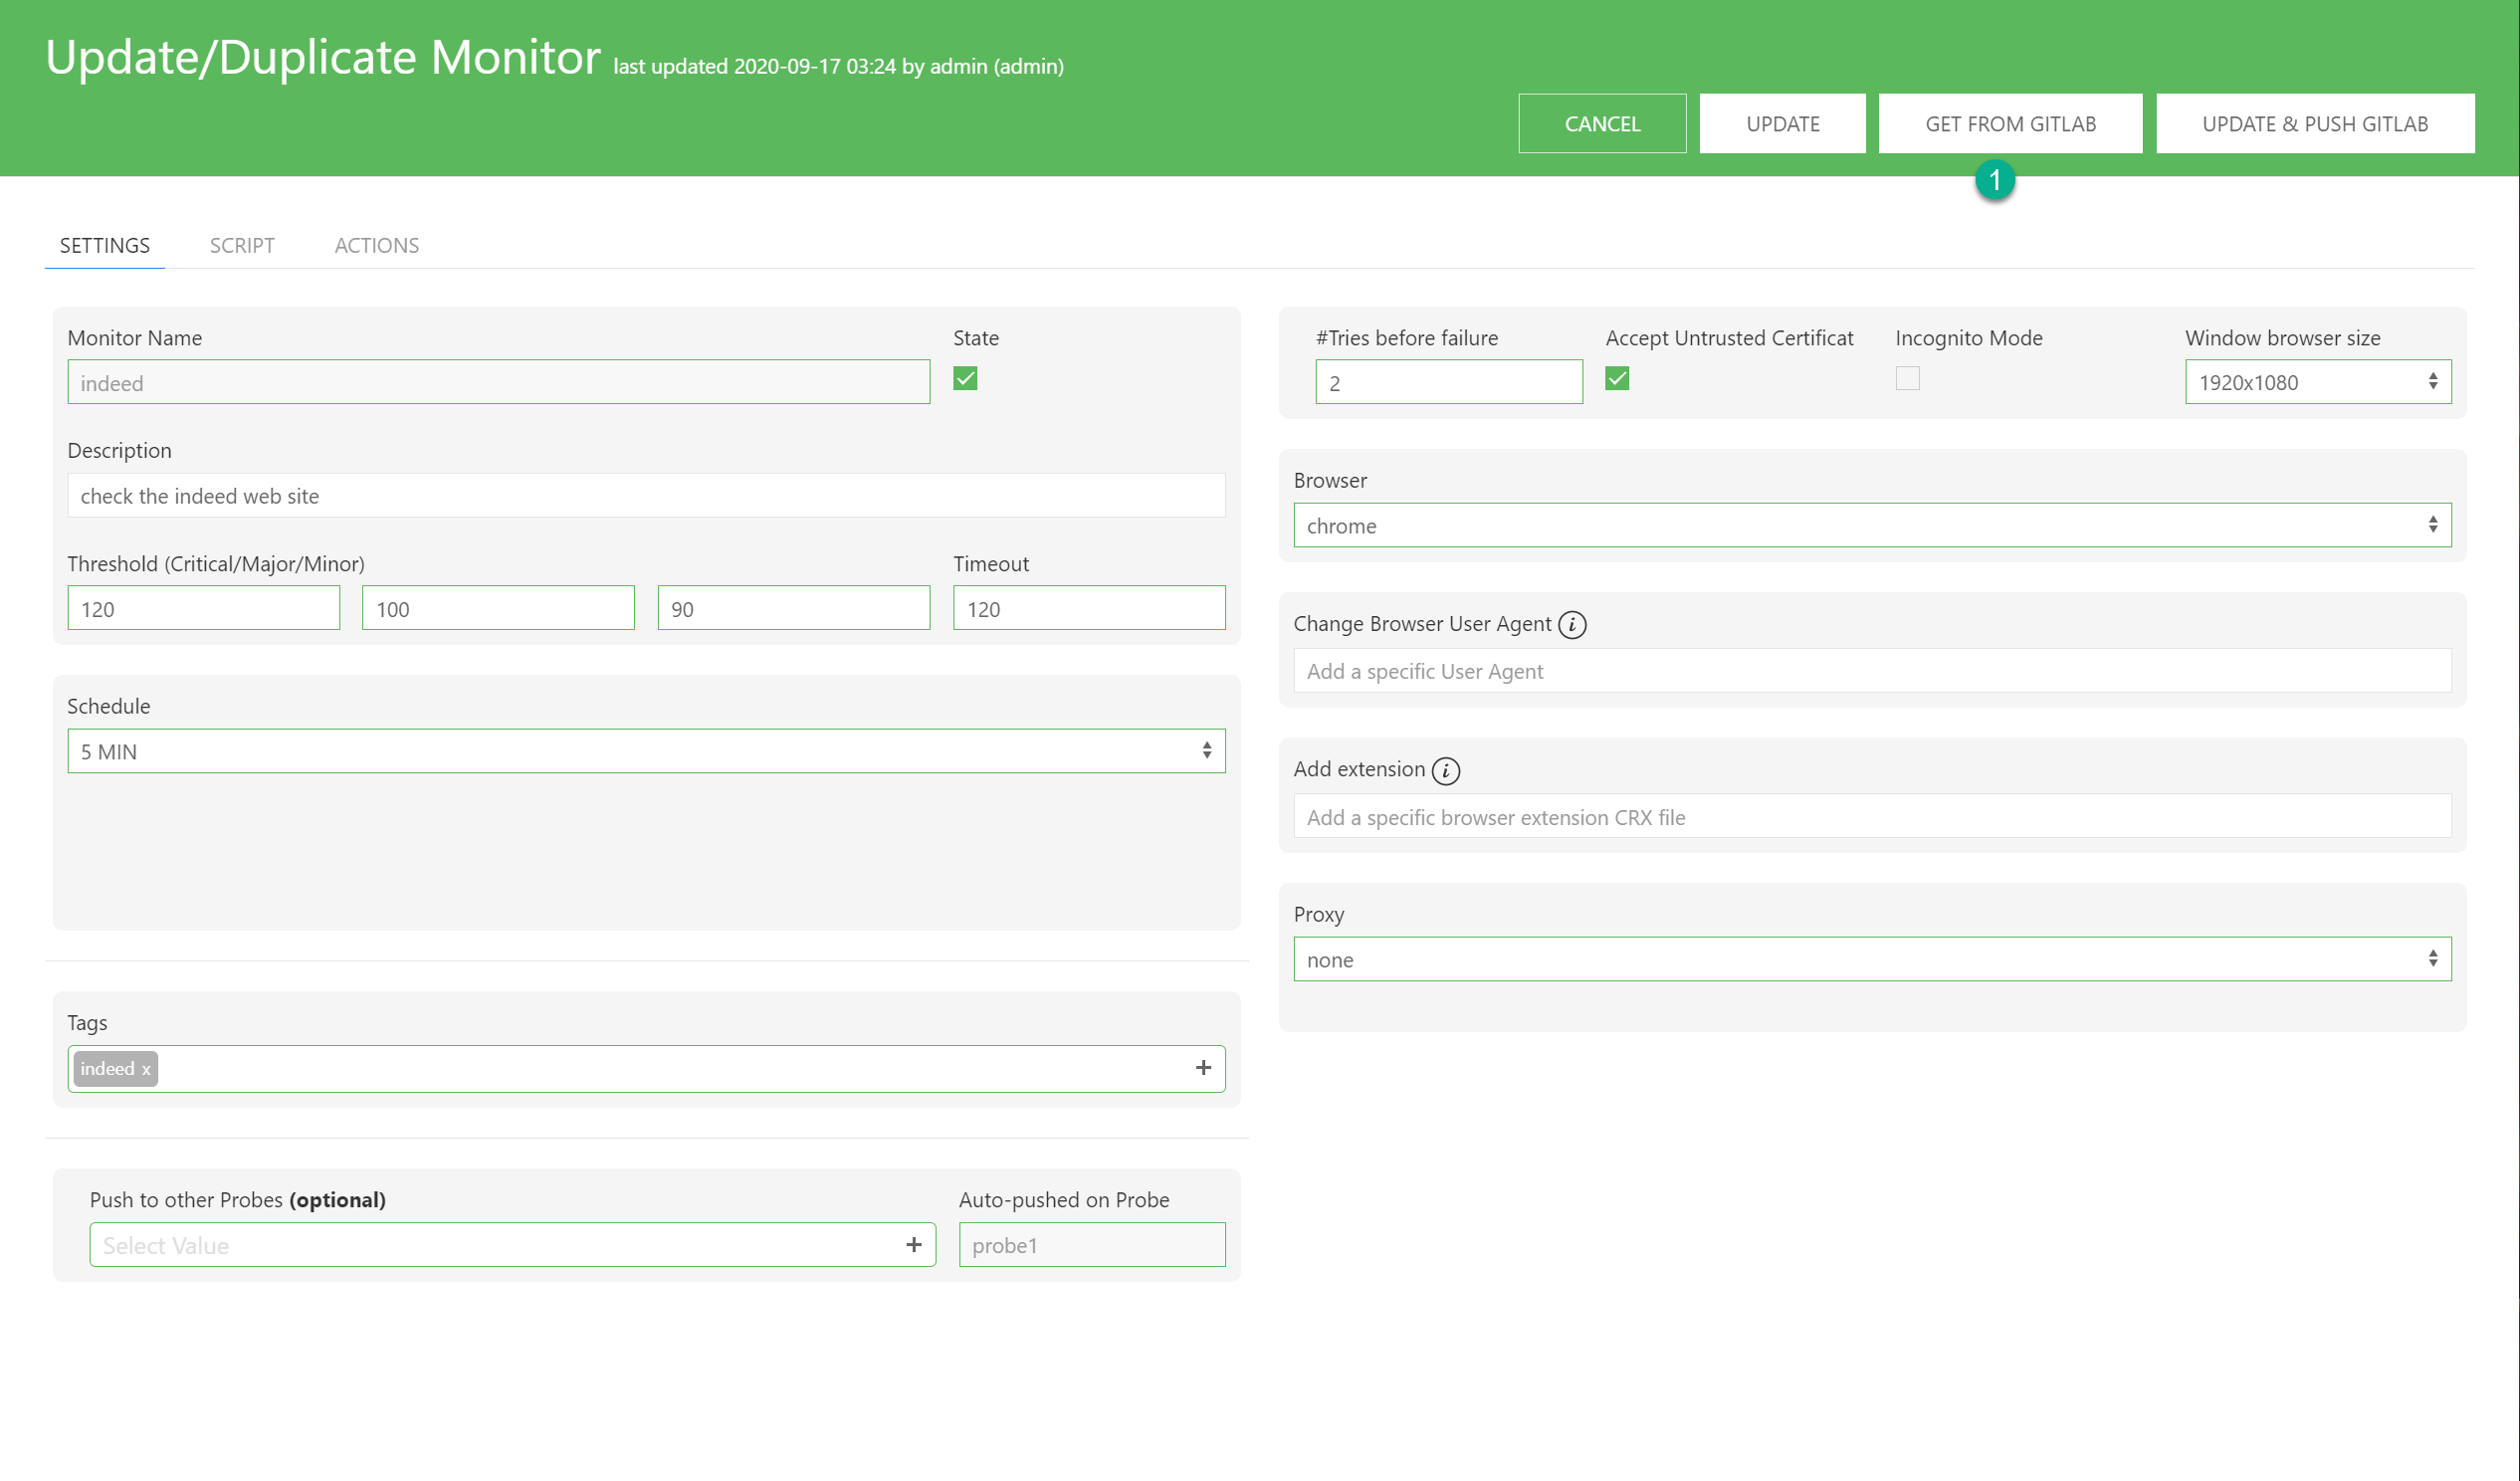
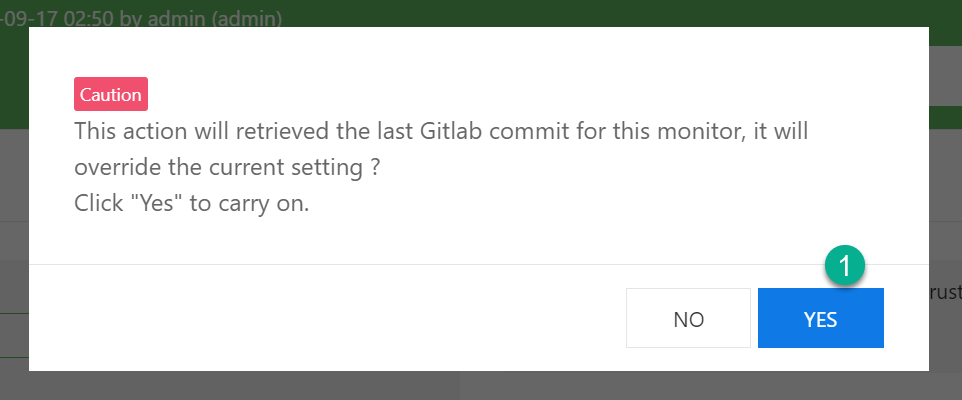
- Confirm to proceed otherwise cancel. Note that this will override any changes made.
At the bottom right, upon success you should see the below notification:
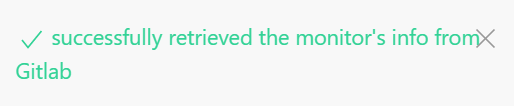
You should see the monitor’s data from the latest commit from.
See also
- Monitor Component Deep Dive — monitor types, scheduling, concurrency, and alerting internals
- Monitor Configuration — all available monitor settings and tuning options
- Monitor HTTP API — programmatic access to monitor operations
- Report Operations — generate and view monitor reports
- Predictions — forecast a monitor’s future response time and predicted status
- SNMP & WMI evaluation — turn OID values or WQL query results into a status with thresholds or regex
- Downtime Operations — schedule maintenance windows for monitors
- Exception Running a Monitor — troubleshoot monitor execution errors