Log in for the first time
This chapter walks you through the first login, checking that the components you installed are connected, and adding a first monitor.
Log in for the first time
- Browse to the Webserver: https://localhost:9090/ on the Webserver host, or its address from your workstation. 9090 is the default web port unless you configured another one; use HTTPS if you configured SSL certificates.
- On the login page, enter admin as username and admin as password: these are the default admin credentials.
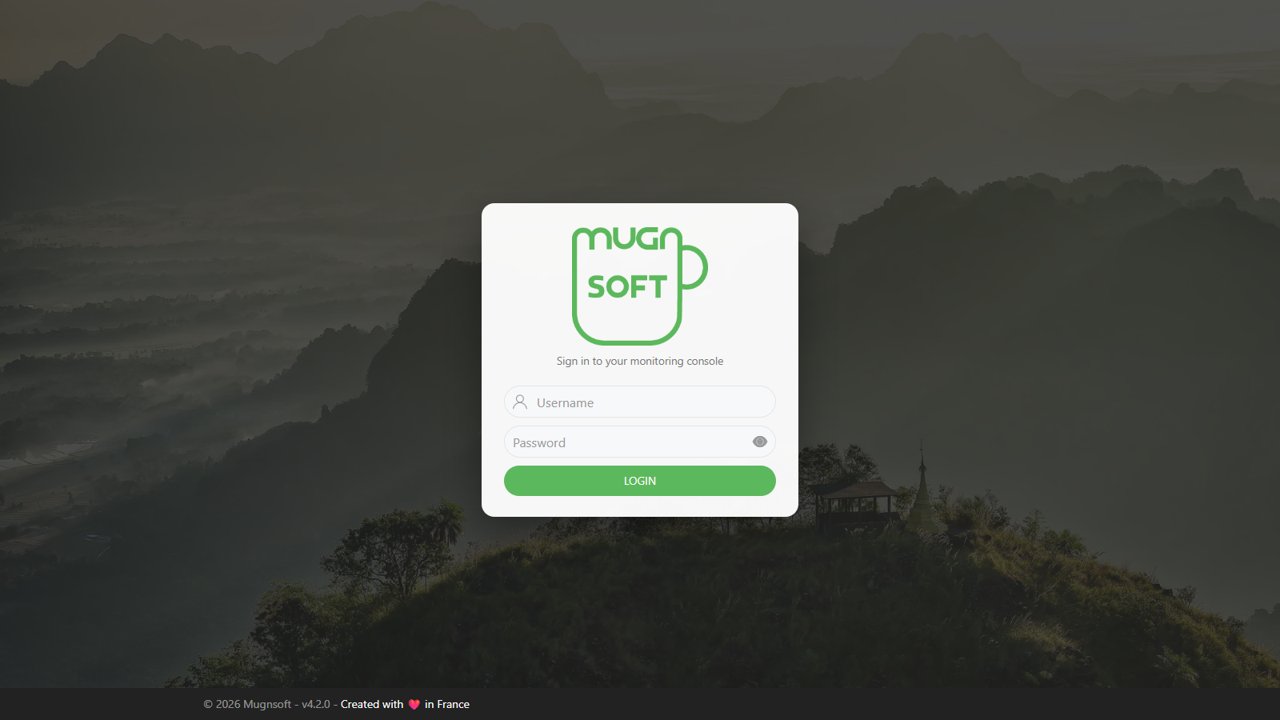
- The default admin must choose a new password at the first login. Record it. The Welcome to Mugnsoft window then offers the guided tour, the recommended path on a fresh installation.
Note:
Using self-registered MNS components (recommended)
Probes, Integrators and Sentinel agents register themselves with the Webserver when they start. Open gear menu → components: they appear in the topology. A newly registered component may be disabled (grey): right-click it and choose enable server.
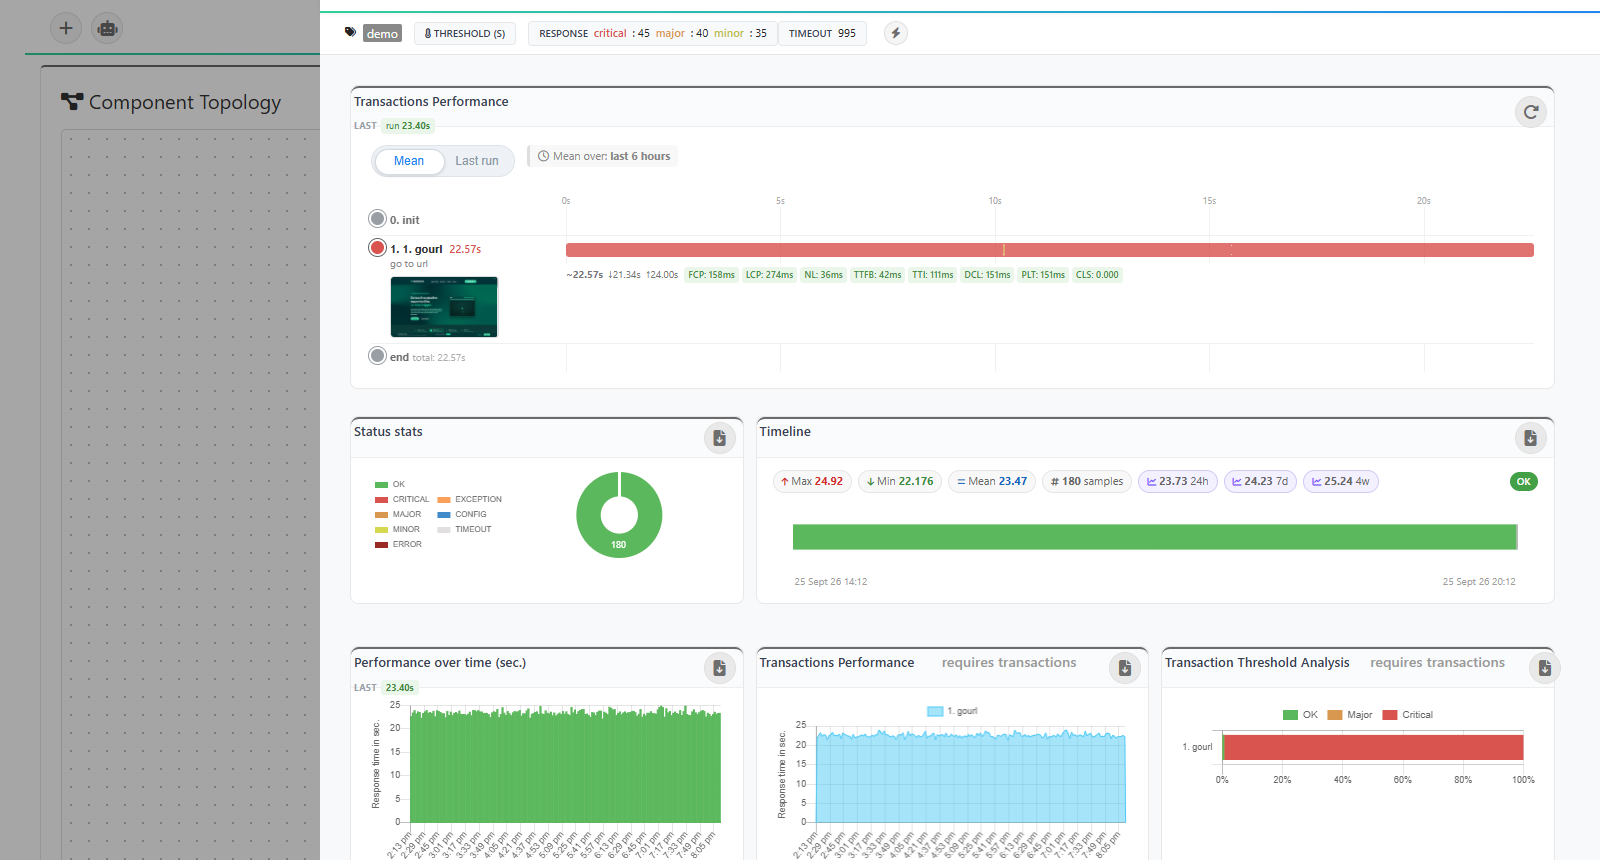
If a component does not answer, right-click it and choose health check, and use the toolbar’s resynchronise the access token button if its token was not synchronised during installation. See Components operations.
Manually add some MNS components
Manually add a MNS Monitor or Integrator
- On the Components page, click +.
- Enter a unique Server Name, choose the Server Type (monitor for a probe, integrator…), its IP, Port and OS, and click the disk icon.
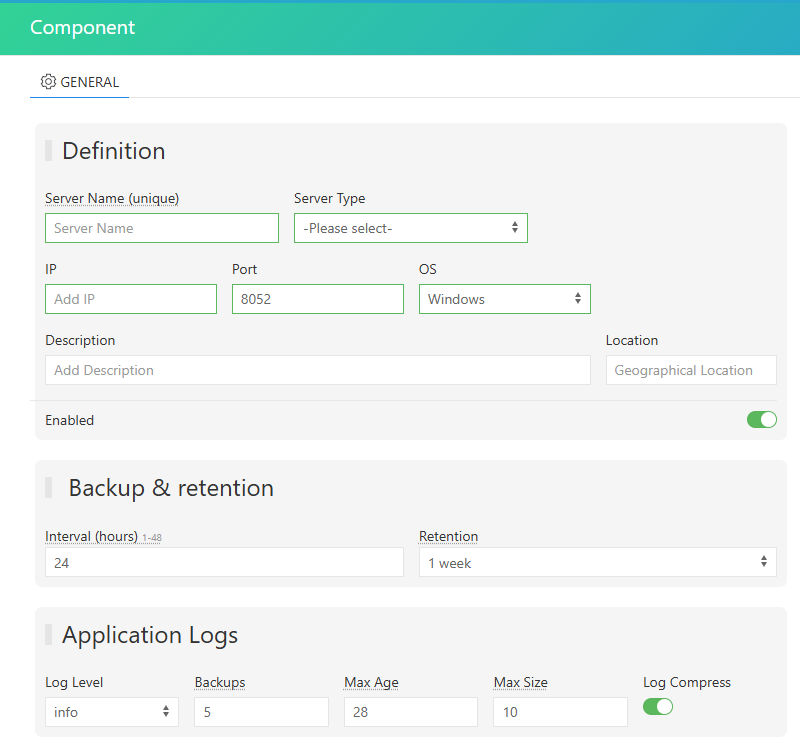
- The component appears in the topology; a notification confirms it.
Link your MNS Monitor to a MNS Integrator
- Right-click the probe and choose edit server.
- Under Integrators & notification resilience, add the Integrator to Integrator endpoints and click the disk icon.
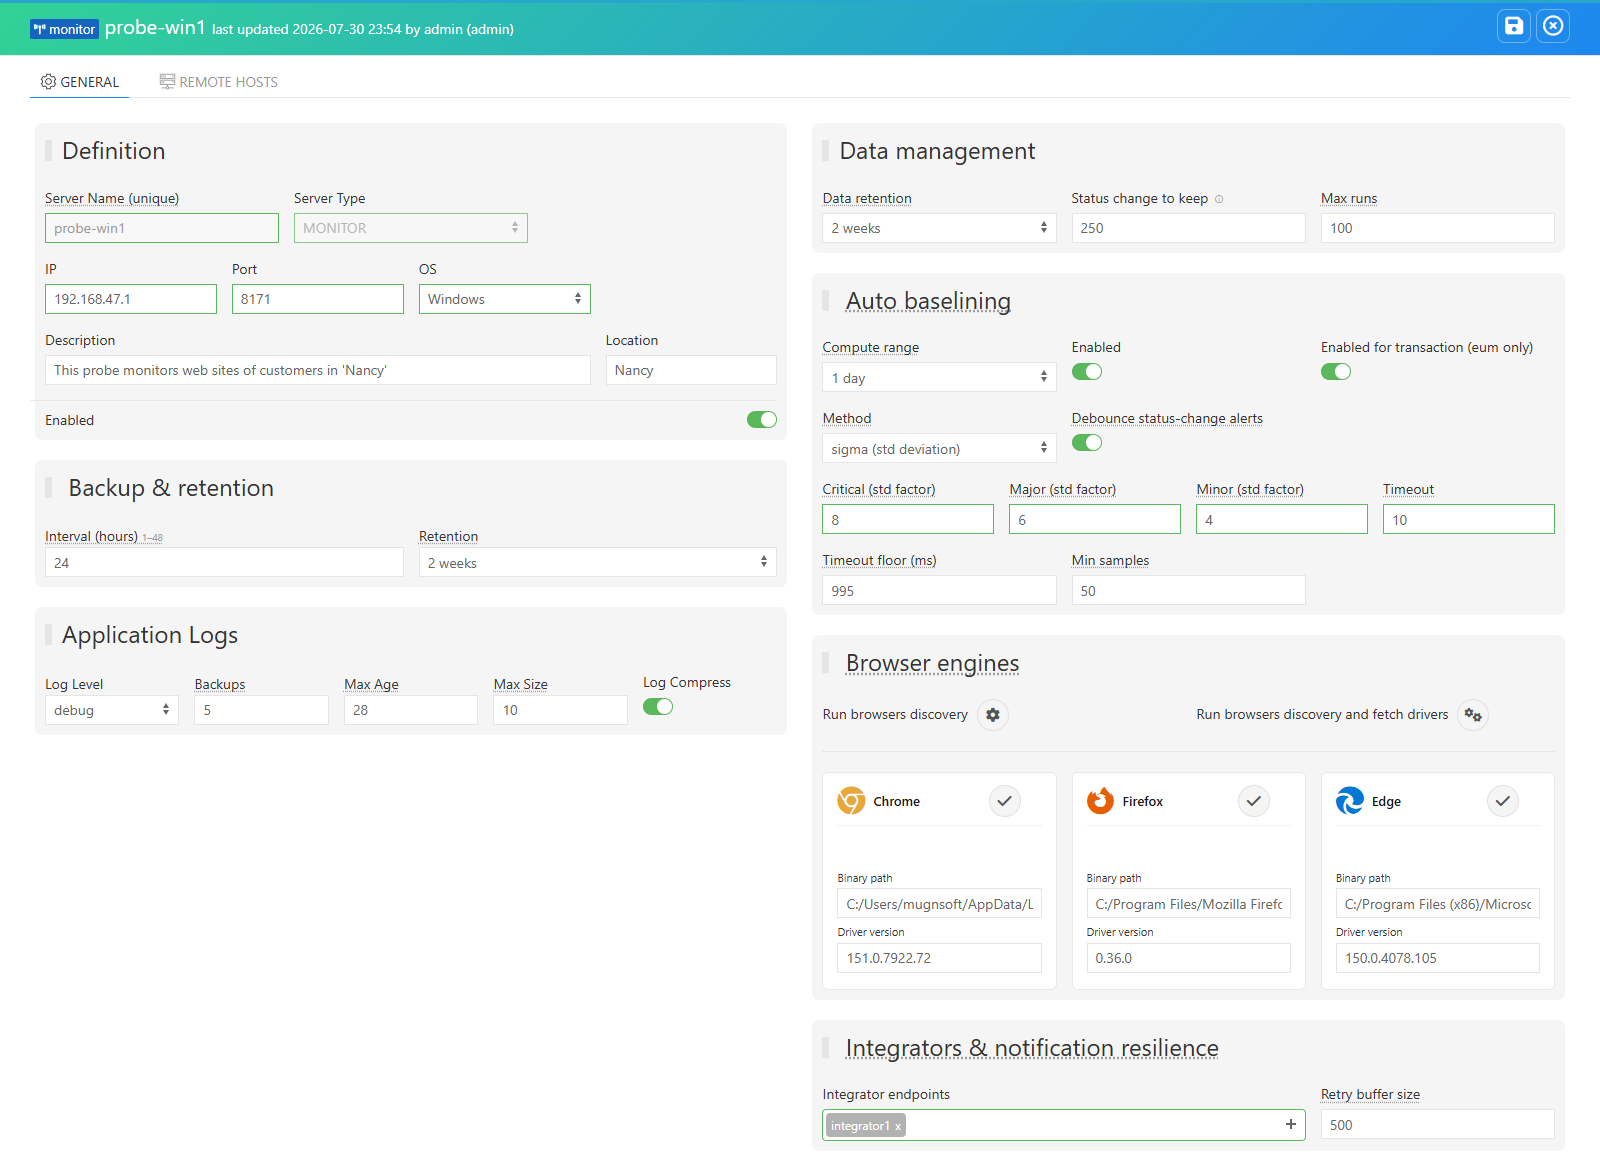
- From now on the probe sends its results to that Integrator, which forwards them to your external tools (see Integration).
Manually add your first monitor
The recommended way to build a user-journey (EUM) scenario is the Mugnsoft IDE, which records it without writing code. For the other types:
- Open the all monitoring page, click + next to the search box and pick the type.
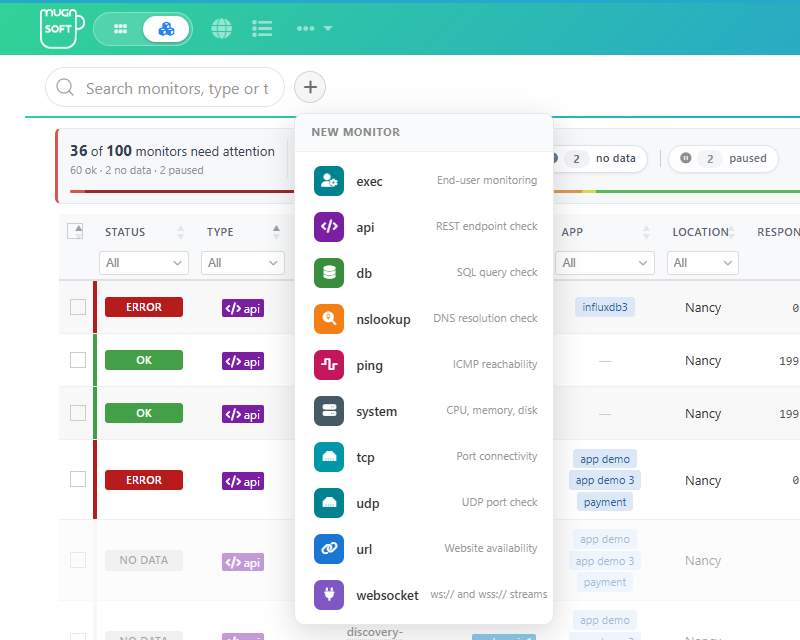
- Fill in the Settings tab (name, probes, schedule, tags, thresholds and the target), and optionally Advanced and Actions. For URL, API, TCP, UDP, Ping, DNS and Database monitors, click Test to check the target from the probe before saving (see Testing a monitor).
- Click the disk icon. The monitor appears in the list and starts on its schedule.
See Monitor operations for everything you can do with it next.