Getting started
Read this page once before your first click. It gives you the four components, what you can monitor, how a result becomes a status, where things are in the interface, and the order in which to learn the rest.
Mugnsoft in one picture
Mugnsoft is made of four programs. Each one is a single binary with its own embedded database: there is nothing else to install.
| Component | What it does | Think of it as |
|---|---|---|
| Webserver | The Web UI (port 9090) and the REST API (port 8050). You configure everything here. | The control room |
| Monitor, also called a probe | Runs the checks on a schedule, from where it is installed. Install several to test from several places. | The tester |
| Integrator | Receives every result, sends the alerts (email, Slack, Teams, PagerDuty) and forwards data to your tools (InfluxDB, Splunk, Elastic, Kafka, Zabbix…). | The dispatcher |
| Sentinel Agent | Watches the host it runs on: CPU, memory, disks, processes, logs, folders, and who talks to whom on the network. | The host watcher |
Default ports, as proposed by the Component Config Builder: probe 8072, Integrator 8060, Sentinel Agent 8078. Each one is the port value of the component’s configuration file, and you can change it.
How they work together:
- A probe runs a check and grades the result.
- The Webserver asks the probes for their statuses and shows them live.
- The probe also sends each result to its Integrator, which notifies you and feeds your other tools.
- A Sentinel Agent does the same for the host it is installed on.
A fifth, optional program, the Webserver-Front, is a read-only copy of the UI for a DMZ. See Components for the detail of each one.
What you can monitor
| You want to check | Monitor type |
|---|---|
| A real user journey in a browser, step by step | EUM / Web UI |
| A web page, or a REST endpoint and its payload | URL, API |
| A real-time stream | WebSocket |
| A port, a host, a name | TCP, UDP, Ping, DNS |
| A database query and its result | Database (MySQL, SQL Server, PostgreSQL, Oracle) |
| A network device or a Windows host, without an agent | SNMP, WMI |
| Kubernetes or Docker workloads | Workload |
| The probe’s own host | System |
| A host in depth: processes, logs, folders, network map | Sentinel Agent |
Monitor types explains what each type proves and how it is graded. Host monitoring covers the Sentinel Agent.
How a result becomes a status
Every check ends with one status. When a monitor runs several checks, it takes the most severe.
| Status | Meaning |
|---|---|
| OK | The check passed, within its thresholds. |
| MINOR, MAJOR, CRITICAL | The check passed, but a threshold was crossed. |
| ERROR | The check failed: target unreachable, wrong content, failed step. |
| TIMEOUT, EXCEPTION, CONFIG | The check could not finish, start, or find its configuration. |
| DOWNTIME | The monitor is inside a maintenance window: no alert. |
Thresholds are either values you type or values Mugnsoft computes from history. See How thresholds work.
Where things are in the interface
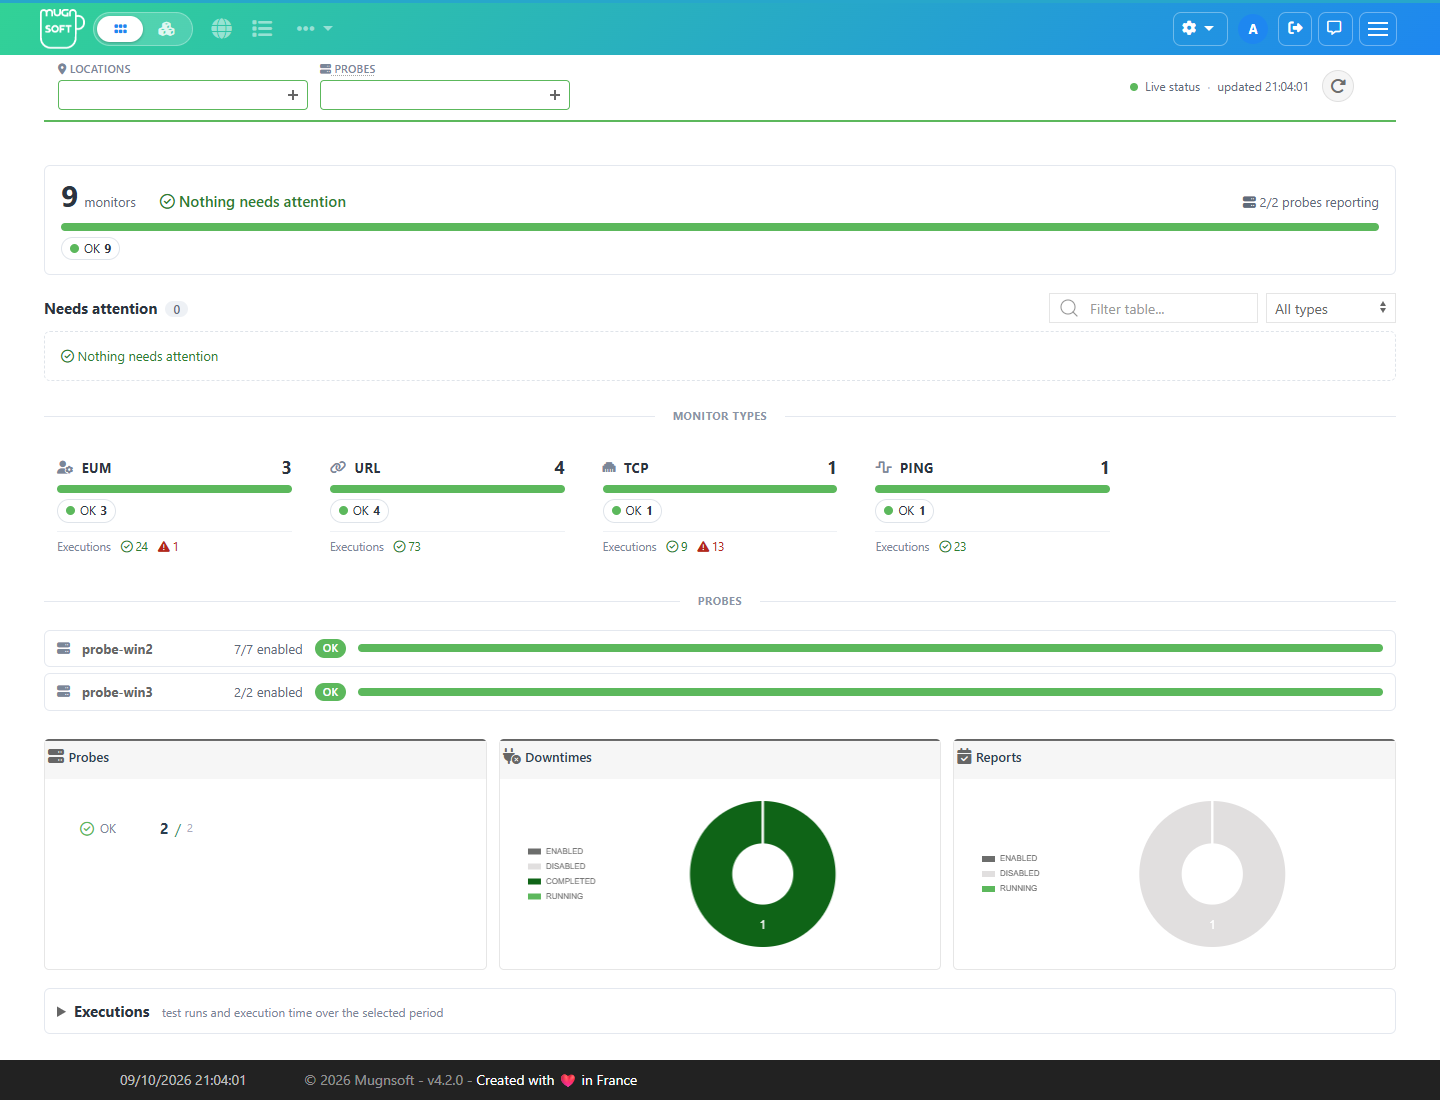
| Question | Page | How to reach it |
|---|---|---|
| Is anything wrong right now? | Overview | The Mugnsoft logo |
| How are my business services doing? | Applications, grid or 3D | The two-button switch next to the logo |
| What is the last value of each monitor? | All monitoring | The globe icon |
| What changed, when, and why? | Events | The list icon |
| How do two monitors compare? | Compare | … menu |
| Who receives which report? | Reports | … menu |
| When is maintenance planned? | Downtimes | … menu |
| Are my probes and agents connected? | Components | Gear menu |
| Users, tags, API keys, settings | Administration | Gear menu |
Each user chooses the language of the interface (English, French or Spanish) in their profile.
Words you will meet
- Probe: a Monitor component. A monitor always runs on a probe.
- Application: a group of monitors that represents a business service, with its own status and SLA. See App definition.
- Tag: a label on monitors, components and users. Tags build applications and decide what each user can see.
- Threshold: the limit that turns OK into MINOR, MAJOR or CRITICAL.
- Downtime: a planned window during which a monitor does not alert.
- Event: a status change kept by the Integrator, shown on the Events page.
- Token: what a user, a script or a component presents to be allowed in. See Security Model.
Learn in this order
- Install the four components on one machine: Quick install.
- Log in and follow the guided tour: Log in for the first time.
- Create a monitor and test it before saving: Monitor types, then Testing a monitor.
- Read the results: Overview, Monitor operations, Events.
- Group monitors into applications: App definition.
- Tune the alerts: Thresholds, then Downtimes.
- Connect your tools: Quick send to 3rd parties and Integration.
- Go further: Sentinel Agent, Container monitoring, Reports, REST API.