Report operations
This section describes how to add/edit/delete report.
A report contains the following information: a monitor’s status over time (known as the monitor’s timeline), its performance over time, its response time for successful transactions over time, and its status distribution.
Reports can be sent by email at a specified scheduled time or immediately upon request.
Reports are organized using tags from the monitors.
Report types
When creating a report you first pick its type, which determines both the scope selector and the content of the generated email:
- Per monitor type — browser script (exec), URL, API, TCP, UDP, ping, nslookup, DB, system, SNMP device, WMI device. One report is built and sent per monitor in the computed list: status timeline, performance graph, transaction response times and status distribution over the selected data range. For browser-script monitors a status summary table is also sent.
- Application — one report per selected application, aggregating the health of all monitors belonging to the app (see App definition and data modelling).
- All — a global summary report across the whole monitor inventory visible to the report owner.
- Infrastructure — a fleet report scoped by probes and/or locations instead of monitors: probe health and capacity indicators over the data range.
- Comparison — compares several monitors of the same type side by side (status or health/errors) over the same period; see Compare operations.
On-error screenshots captured by browser-script monitors can also be pulled into a dedicated screenshots report from the monitor’s detail view.
Scope preview
While editing a report, the form can resolve the current tag/monitor selection server-side — without saving — and display the resulting list of monitors (with the probe each one runs on). Use it to check how many individual report emails will actually be generated before you save.
Reports are organized by tags
The computed list of monitors
Reports can be associated with tag(s) and/or monitor(s). The list of monitors they reference is generated from the tag(s) and/or monitor(s).
For instance: mon1 has tag1, mon2 has tag1 , mon3 has tag2, mon4 has no tag. A given report has monitor mon4 and has tag tag1, then the computed list of monitors for this report will be mon1, mon2, mon4. Separate reports will be sent for each monitor in this list.
Accessing reports and user privileges
Users in the ADMIN group can add, edit, or delete a report, as well as add or remove monitor(s) and/or tag(s) from a report.
Users with tags matching those on the report and belonging to the USER group can also add, edit, or delete a report, as well as add or remove monitor(s) and/or tag(s) from a report.
A report can have one or more tags.
Note:
The reports page
Open report from the top menu (or #/report). Each row shows the report’s display name, its type, its schedule, the data range it covers, the monitors it includes (counted per type), its tags, its owner and its state.
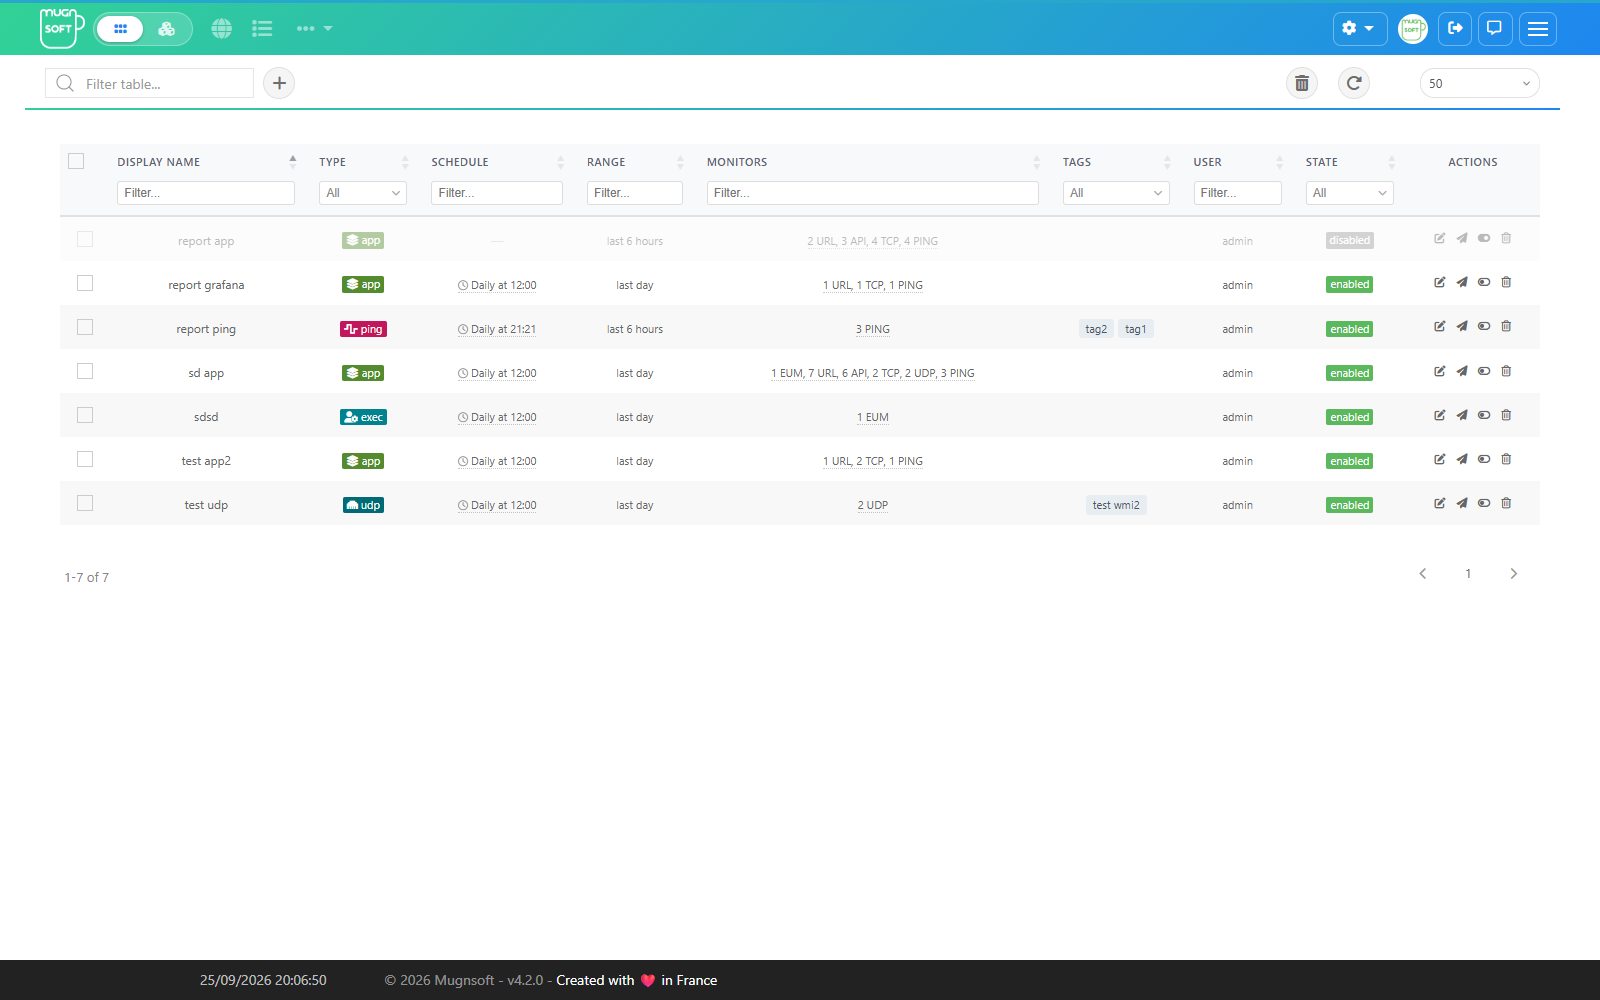
The row actions are Edit (pencil), Send now (paper plane), Disable / Enable (toggle) and Delete (trash). A disabled report is greyed out and is not sent on its schedule.
Add a Report
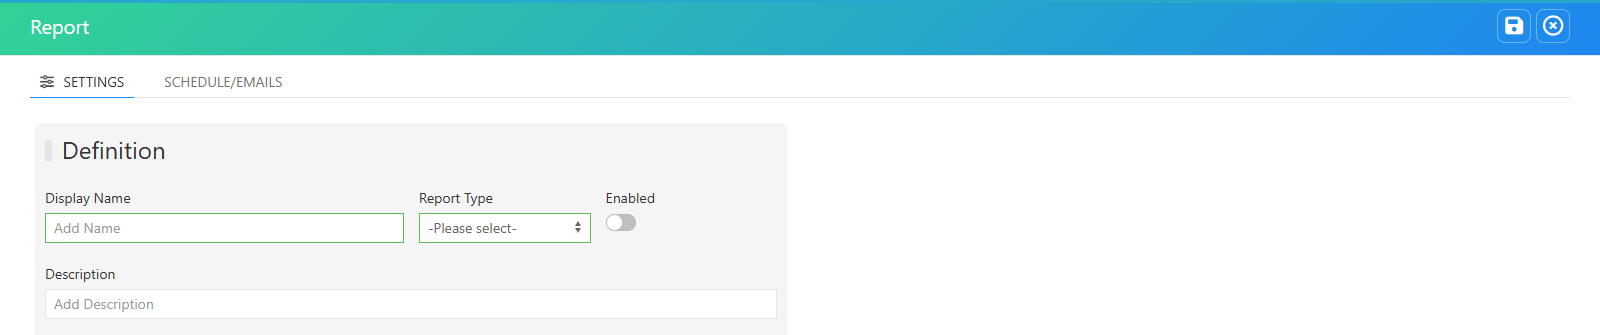
- Click + next to the search box.
- In Settings, enter the Display Name, choose the Report Type (see Report types), set Enabled, add an optional description, then pick what it covers: the list of applications for an app report, or the monitors and tags for the other types. Check the scope preview.
- In Schedule/Emails, set when it is sent, the data range it covers, its language and format and the recipients.
- Click the disk icon to save. The report appears in the list and a notification confirms it.
Language and format
Two fields under Data Range set how the report is delivered.
Language (since 4.2.0): English, French or Spanish. The report page (titles, panels, chart axes, dates) and the email that carries it (subject and body) are written in that language. A new report starts with your own UI language. Reports created before 4.2.0 stay in English until you pick a language.
Format (since 4.2.0):
| Format | Attached to the email |
|---|---|
| HTML (default) | The interactive report page: zoom, tooltips, save a chart as an image. |
| A PDF of the same page, A4 landscape, printed with its colours. | |
| HTML + PDF | Both files. |
The PDF is printed by a headless Chrome, Chromium or Edge on the Webserver host. It costs a few seconds per report and a browser process of 150–300 MB while it prints; at most two reports are printed at the same time. See PDF reports for the browser the Webserver uses.
A PDF needs no Internet access, neither on the Webserver nor for the reader. An HTML report loads its chart libraries from public CDNs when it is opened; if your readers have no Internet access, set the Webserver to embed the libraries in the report.
When the attachments exceed the email size limit they are sent as one zip file. A report sent from a monitor’s own report view is always HTML; the format applies to the reports of this page, on their schedule and with Send now.
Edit a Report
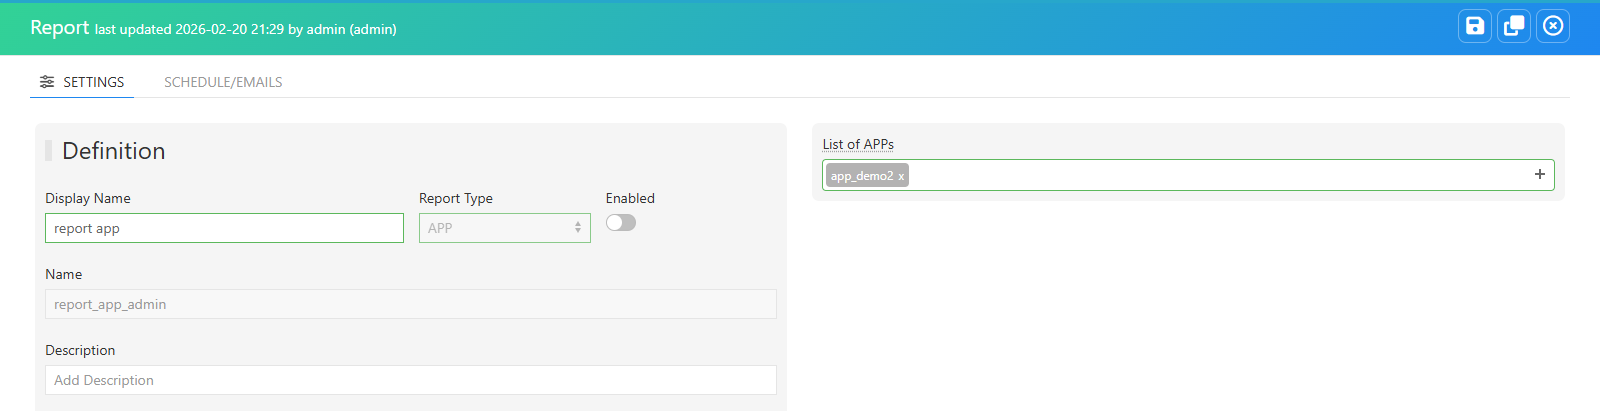
Click the pencil of the row. The same form opens with the report’s values; the header shows who changed it last, and the report type is locked. Change what you need and click the disk icon, or the duplicate icon to save it as a new report.
Send immediately a Report
- Click Send now (paper plane).
- Enter a comma-separated list of email addresses and click OK.
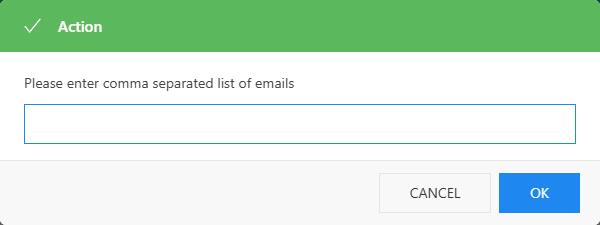
The report is built for its data range and emailed to those recipients; the notifications show the status of each report sent. The schedule and the stored recipients are not changed.
Delete a Report
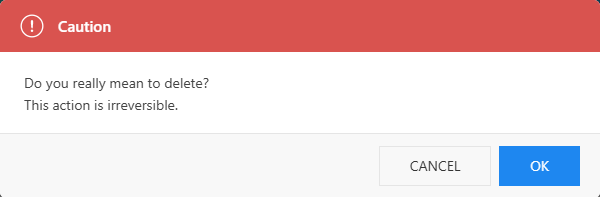
Click the trash of the row and confirm with OK. To delete several reports, tick their rows and use the trash button of the toolbar.
Filter reports
- Type in the Filter table box to match any column.
- Use the filters under the headers: text filters for display name, schedule, range, monitors and user, drop-downs for type, tags and state.
- The page size selector and the arrows under the table paginate it; the refresh button reloads it.
See also
- App definition and data modelling — application reports aggregate monitors through the tag/app model
- Compare operations — side-by-side comparison reports
- Downtime operations — planned maintenance windows on the same scoping model