Webserver settings
The Webserver’s settings cover its own backup and log policy, how it reaches Integrators and the Webserver-Front replica, and the external services it uses: email, repository backup, LDAP and SSO authentication, secret vaults and predictive analytics.
Open the settings
- Open gear menu → components.
- Right-click the webserver node and choose edit server.
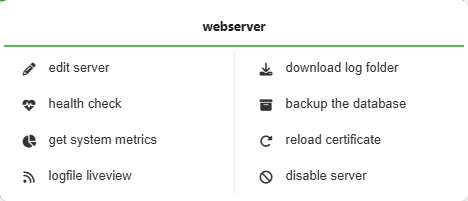
The settings open full screen with three tabs: General, External services and Predictive analytics. The header shows who saved them last. Click the disk icon at the top right to save your changes, or ✕ to close without saving.
General
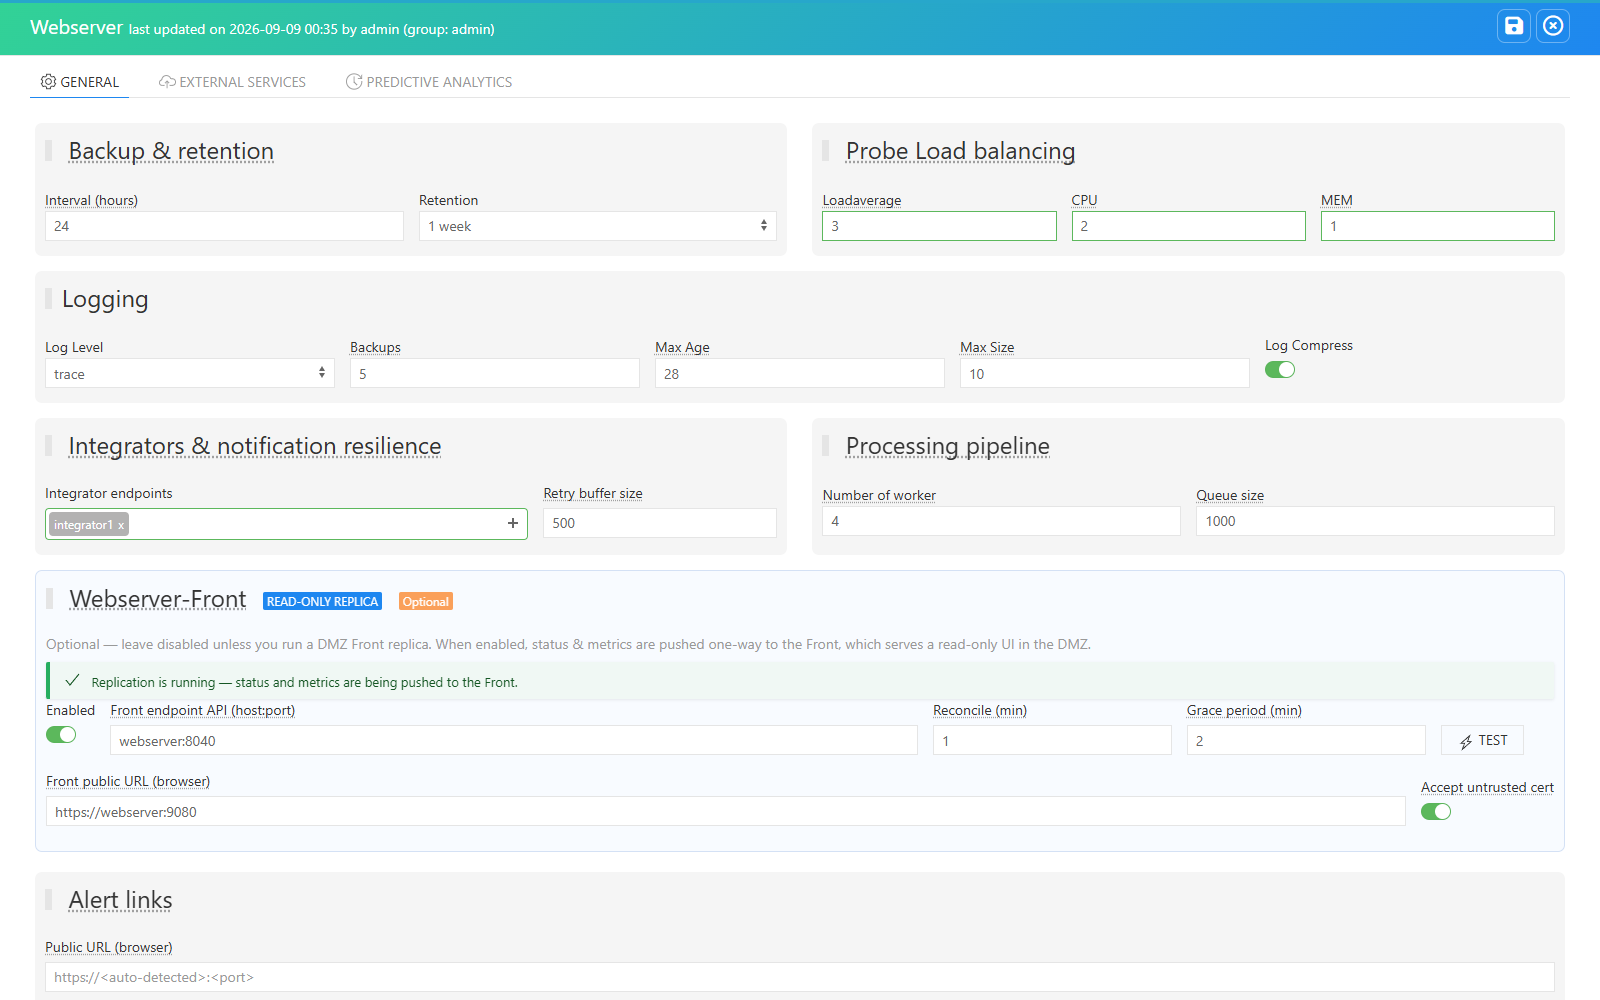
| Section | Settings |
|---|---|
| Backup & retention | Interval (hours) between two automatic KV store backups, and how long backups are kept (Retention). See Backup. |
| Probe Load balancing | The Loadaverage, CPU and MEM weights used by auto-deployment to pick the least loaded probe (defaults 3, 2, 1). |
| Logging | Log Level (the most verbose severity written), Backups (number of rotated files kept), Max Age (days), Max Size (MB per file) and Log Compress. |
| Integrators & notification resilience | The Integrator endpoints the Webserver forwards notifications to, and the Retry buffer size: how many failed notifications are kept on disk and retried. |
| Processing pipeline | Number of worker and Queue size used to process Sentinel agent data files. Raise them if many agents report at the same time. |
| Webserver-Front | Optional read-only DMZ replica: see below. |
| Alert links | The Public URL used in the links of alert emails. Leave it empty to use the auto-detected address. |
| Reports | HTML report libraries: whether emailed HTML reports load their libraries from the Internet or carry them. See below. |
Webserver-Front replication
Leave this section disabled unless you run a Webserver-Front replica. When enabled, status and metrics are pushed one way to the Front. The banner shows whether replication is running.

- Front endpoint API (host:port) — where the Front listens for replication.
- Reconcile (min) — how often a full reconcile is pushed.
- Grace period (min) — how long a fresh OK → non-OK application status is held back from the Front. See Webserver-Front operations.
- Front public URL (browser) — the Front’s user-facing web address (not the replication endpoint). When set, the share links on the Users page point at the Front. Accept untrusted cert (off by default) makes TEST accept a public URL served with a self-signed or internal-CA certificate; the replication check always verifies against the replication CA.
- TEST checks that both the replication endpoint and the public URL answer.
Reports without Internet access
An HTML report is a web page: it loads its libraries (Chart.js, UIkit, jQuery, moment…) from public CDNs such as cdn.jsdelivr.net when the recipient opens it. A reader whose computer has no Internet access sees a report without charts or layout.
HTML report libraries (since 4.2.0) chooses where those libraries come from:
| Choice | HTML report | Size |
|---|---|---|
| From the Internet (CDN) (default) | Loads its libraries from the CDNs: the reader needs Internet access. | As in previous versions |
| Embedded in the report (opens offline) | Carries its libraries: opens with no network at all. French and Spanish reports also carry their date formats. | About 820 KB more per report file, about 1.1 MB more in the email (attachments are base64-encoded) |
- The libraries come from the Webserver itself: the Webserver host needs no Internet access with either choice.
- It applies to every report sent by email from the next send on: scheduled, Send now, infrastructure, comparison and browser-script status table reports. No restart is needed.
- PDF reports need no setting: they never use the Internet (see PDF reports).
External services
Each service is a tile. The switch on the tile enables or disables it, the ⚡ button tests it, and clicking the tile opens its settings underneath.
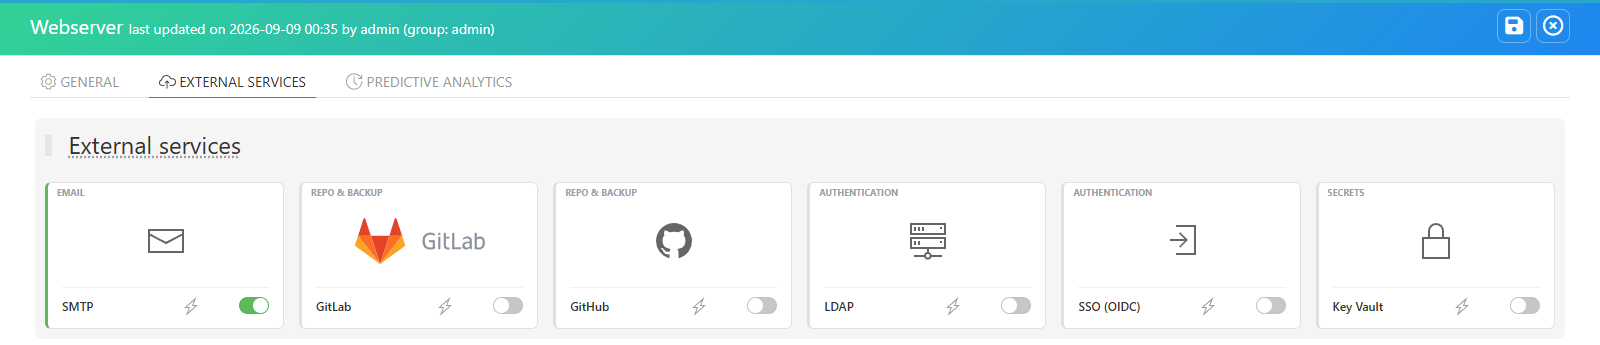
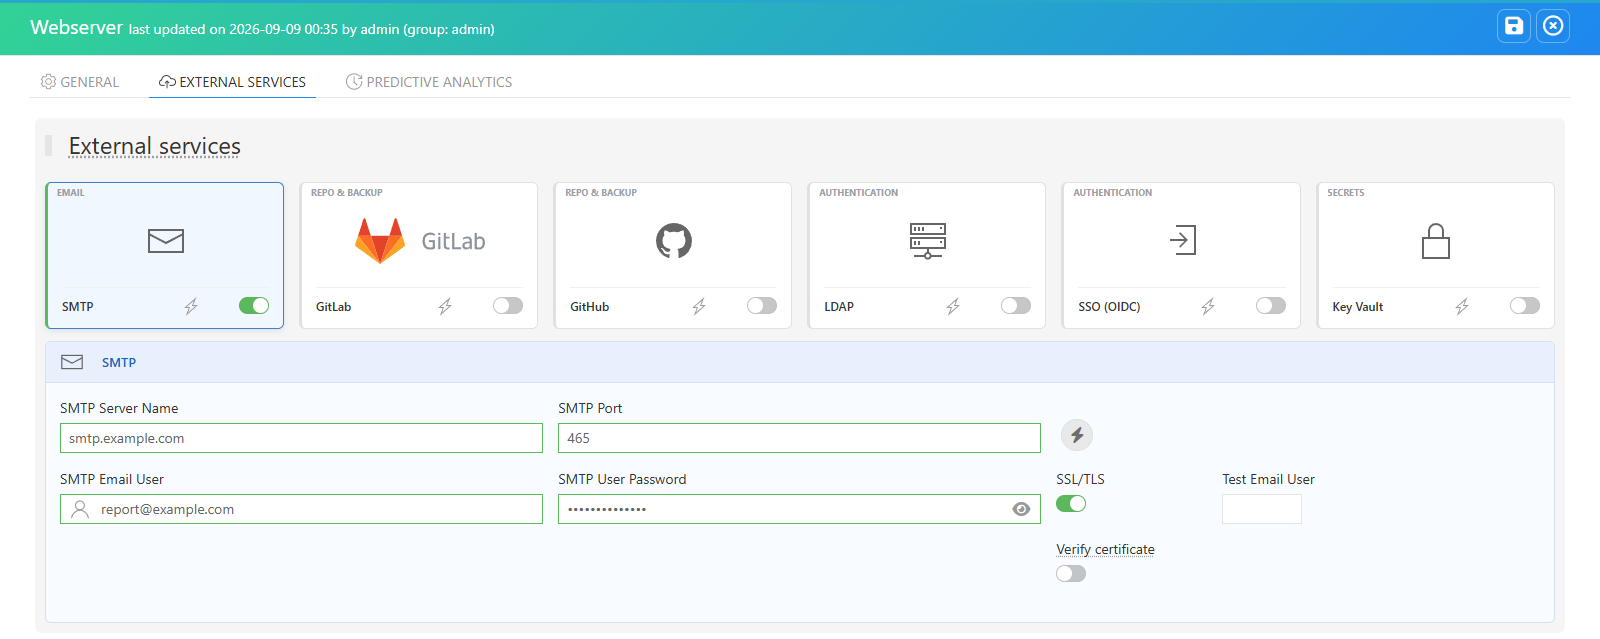
SMTP
Used to send reports and alert emails.
- Fill in SMTP Server Name, SMTP Port, SMTP Email User and SMTP User Password, and set SSL/TLS.
- Verify certificate — when on, the Webserver and every component (probes, integrators, discovery agents) check the SMTP server certificate against the system trust store plus
config/ssl/certificates. Leave it off for a server with a self-signed certificate; the connection stays encrypted either way. - Enter a Test Email User and click ⚡: a test email is sent, and the result is shown in a notification.
GitLab and GitHub
Store monitor definitions and scripts in a repository, and back up the configuration as a CSV snapshot. Fill in the repository coordinates and the access token, then click ⚡ to test the connection. Include secrets in CSV backups is off by default: passwords, tokens and SNMP/WMI credentials are redacted unless you tick it — use a private repository if you do.
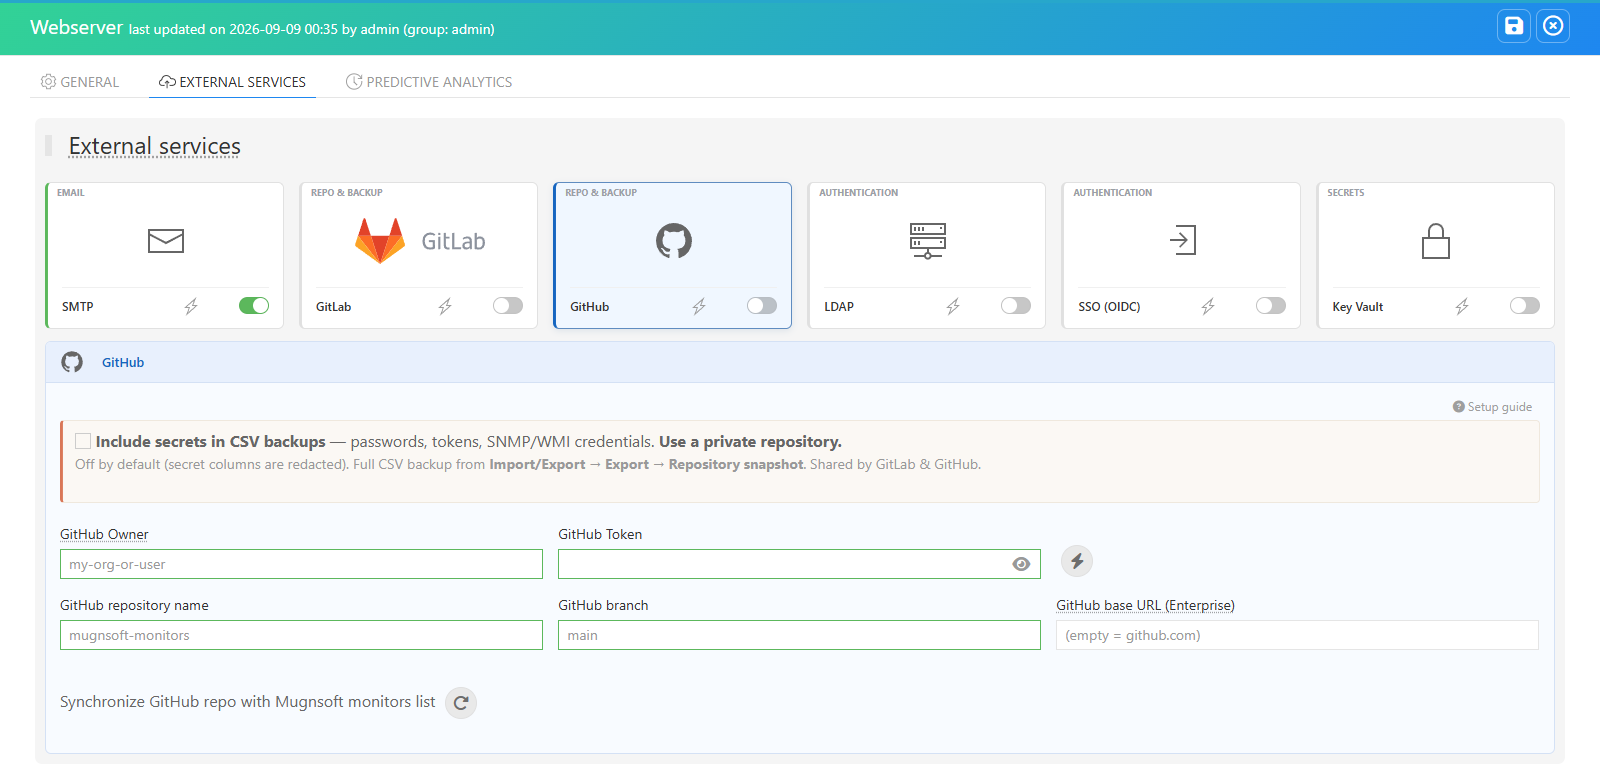
With GitLab enabled, monitor edit forms carry update & Push Gitlab and get from Gitlab buttons. See Monitor operations → GitLab and Backup.
LDAP
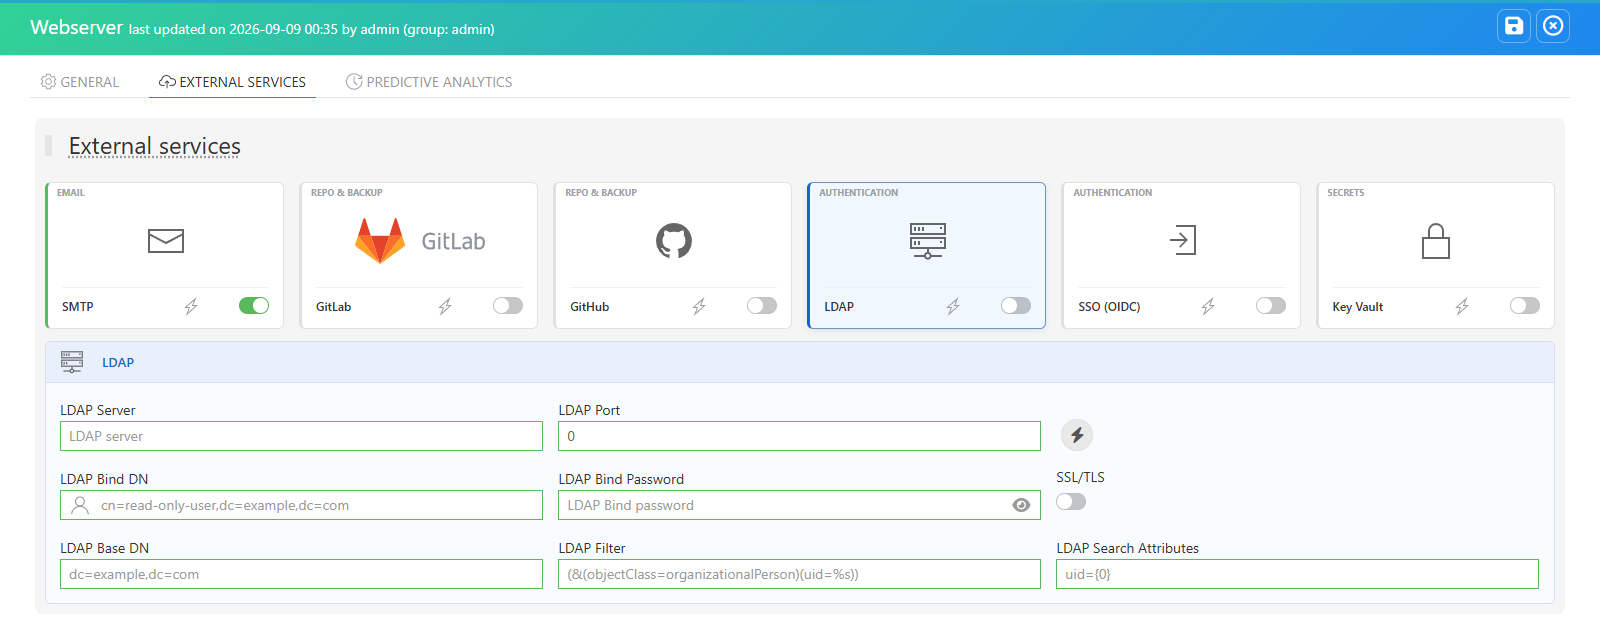
Authenticate users against a directory: LDAP Server, LDAP Port, SSL/TLS, the Bind DN and password of a read-only account, the Base DN, the LDAP Filter and the Search Attributes. Click ⚡ to test. See Authentication.
SSO (OIDC)
Single sign-on through an OpenID Connect provider (Keycloak, Entra ID, Okta…): issuer, client, claims, group-to-role mapping, and the separate public client of a Webserver-Front. See SSO (OIDC).
Key Vault
Resolve monitor credentials from a secret vault (HashiCorp Vault, Azure Key Vault, CyberArk) instead of storing them. Pick the Key Vault Type and fill in its connection. See Secret vaults.
Predictive analytics
Connects the Webserver to the prediction service that forecasts monitor response times. It needs a running Prediction API and an Integrator forwarding monitor data to InfluxDB, which the prediction service reads.
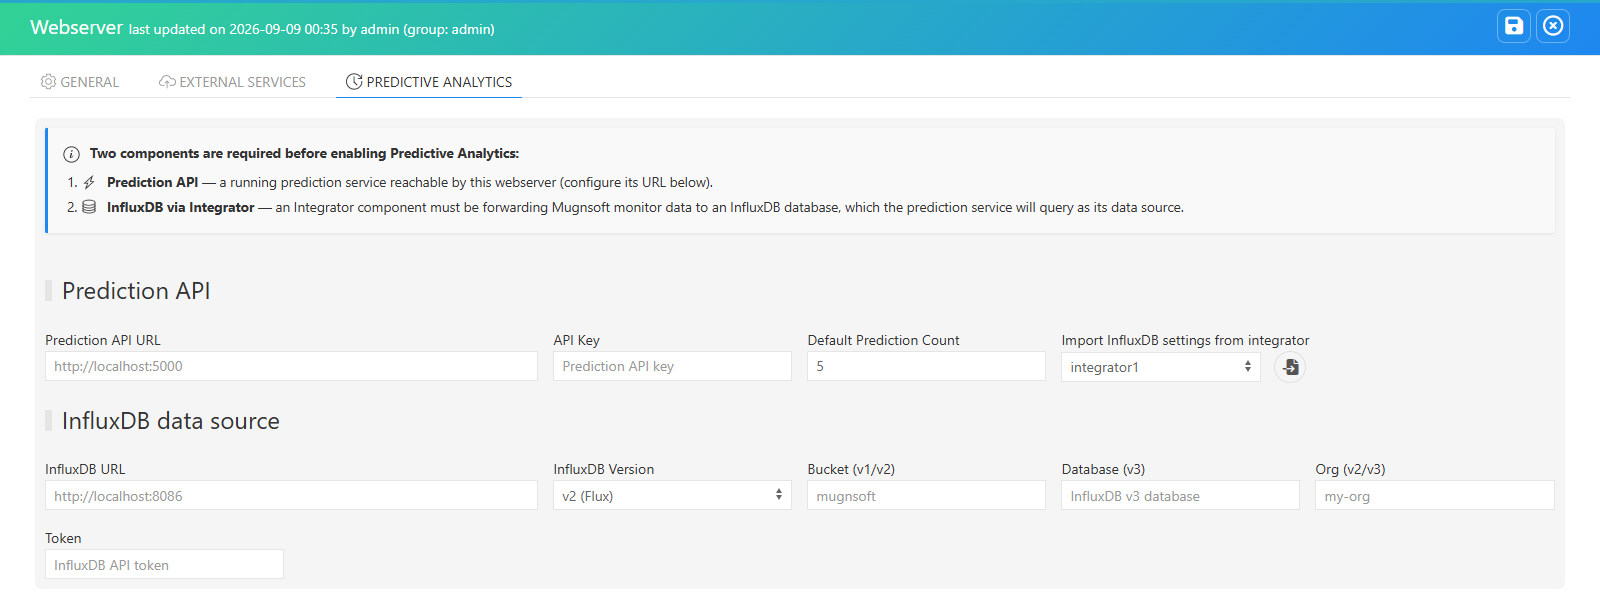
Fill in the Prediction API URL and API Key, then the InfluxDB data source — or import it from an Integrator with Import InfluxDB settings from integrator. See Predictions.
Webserver log
The log settings are in General → Logging. From the webserver node’s menu:
- logfile liveview streams the current log into a window while it is open — raise the Log Level temporarily for more detail;
- download log folder downloads every log file as an archive, without connecting to the server.
See Components operations → Live view.