Components operations
This section describes operations related to Mugnsoft components.
Below are the three main components of a Mugnsoft infrastructure.
- MNS Webserver: The Webserver is the component that manages the whole infratrsucture and data. Components (a.k.a. Servers), Monitors, Reports, Downtimes, Users are managed through the Webserver WebUI. It bundles its own API interface that starts up at the same time as its webUI.
- MNS Monitor: A probe is the component in charge of executing the business transaction scenarios, URL and API checks. It exposes an API interface.
- MNS Integrator: An Integrator is the component in charge of integrating the business transaction scenarios, URL or API data to external products. It exposes its own API interface.
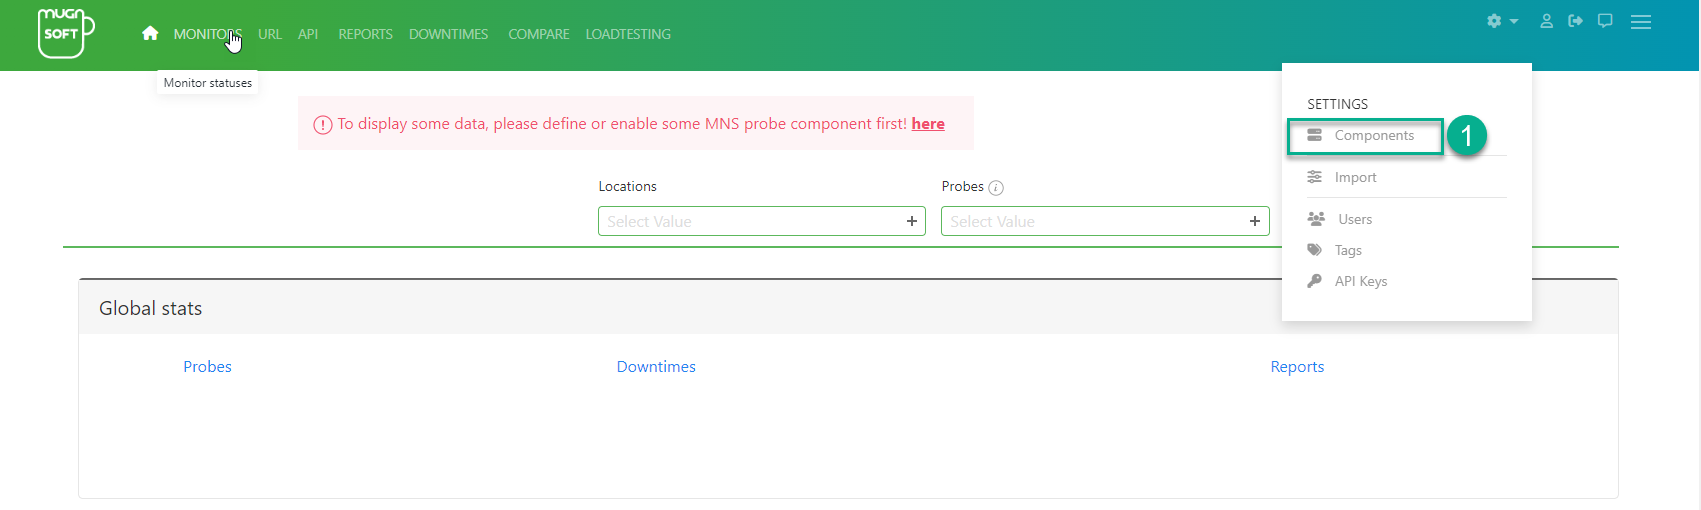
Add a MNS server
- once logged in, click on the server icon in the top level menu
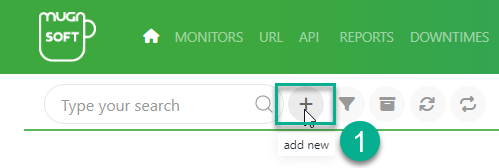
- click on the “plus” icon button
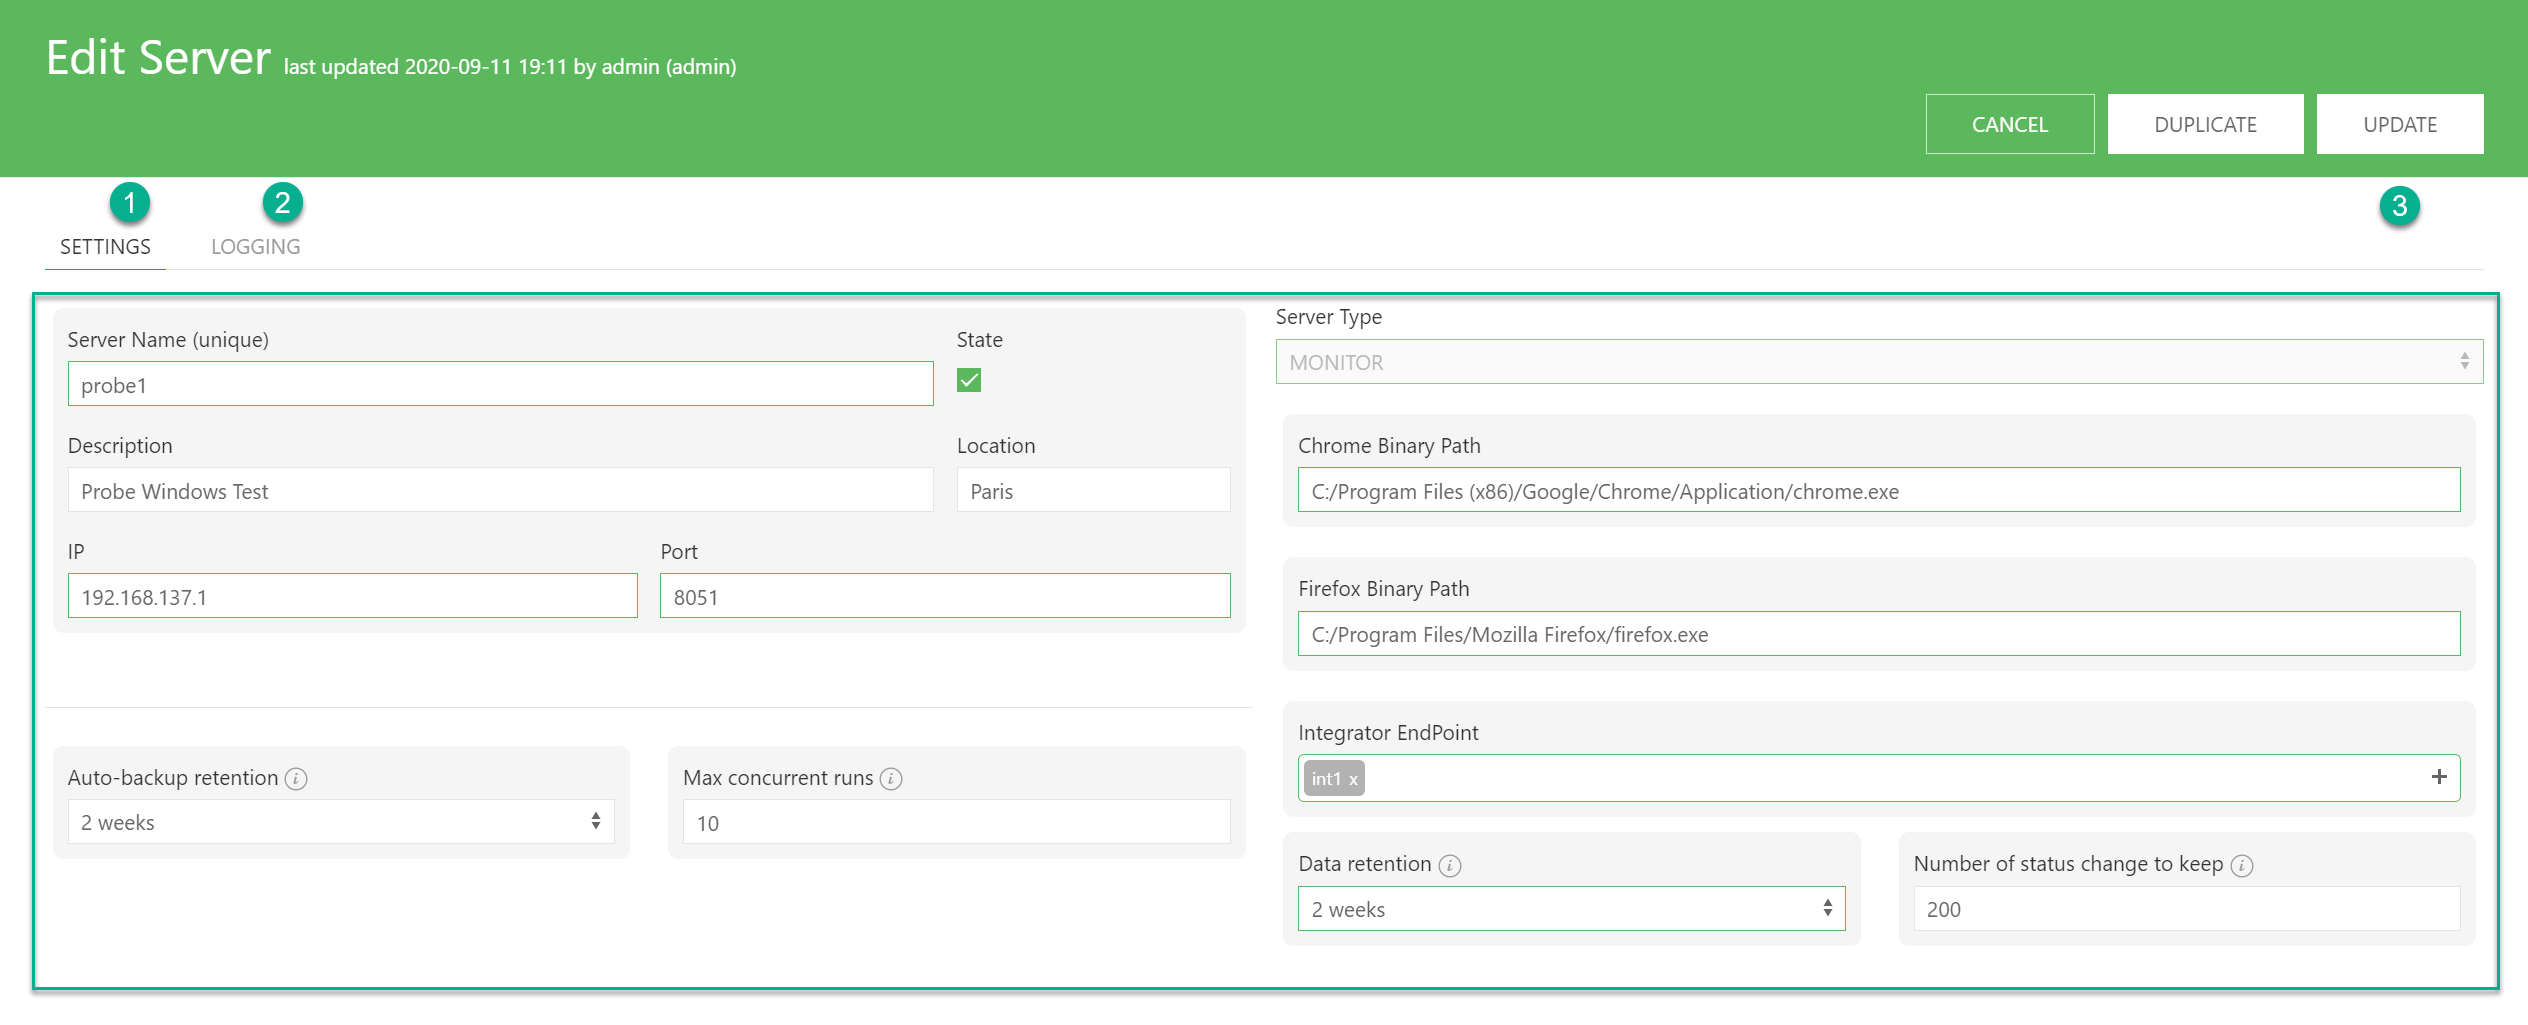
- fill in the tabs form, and click save
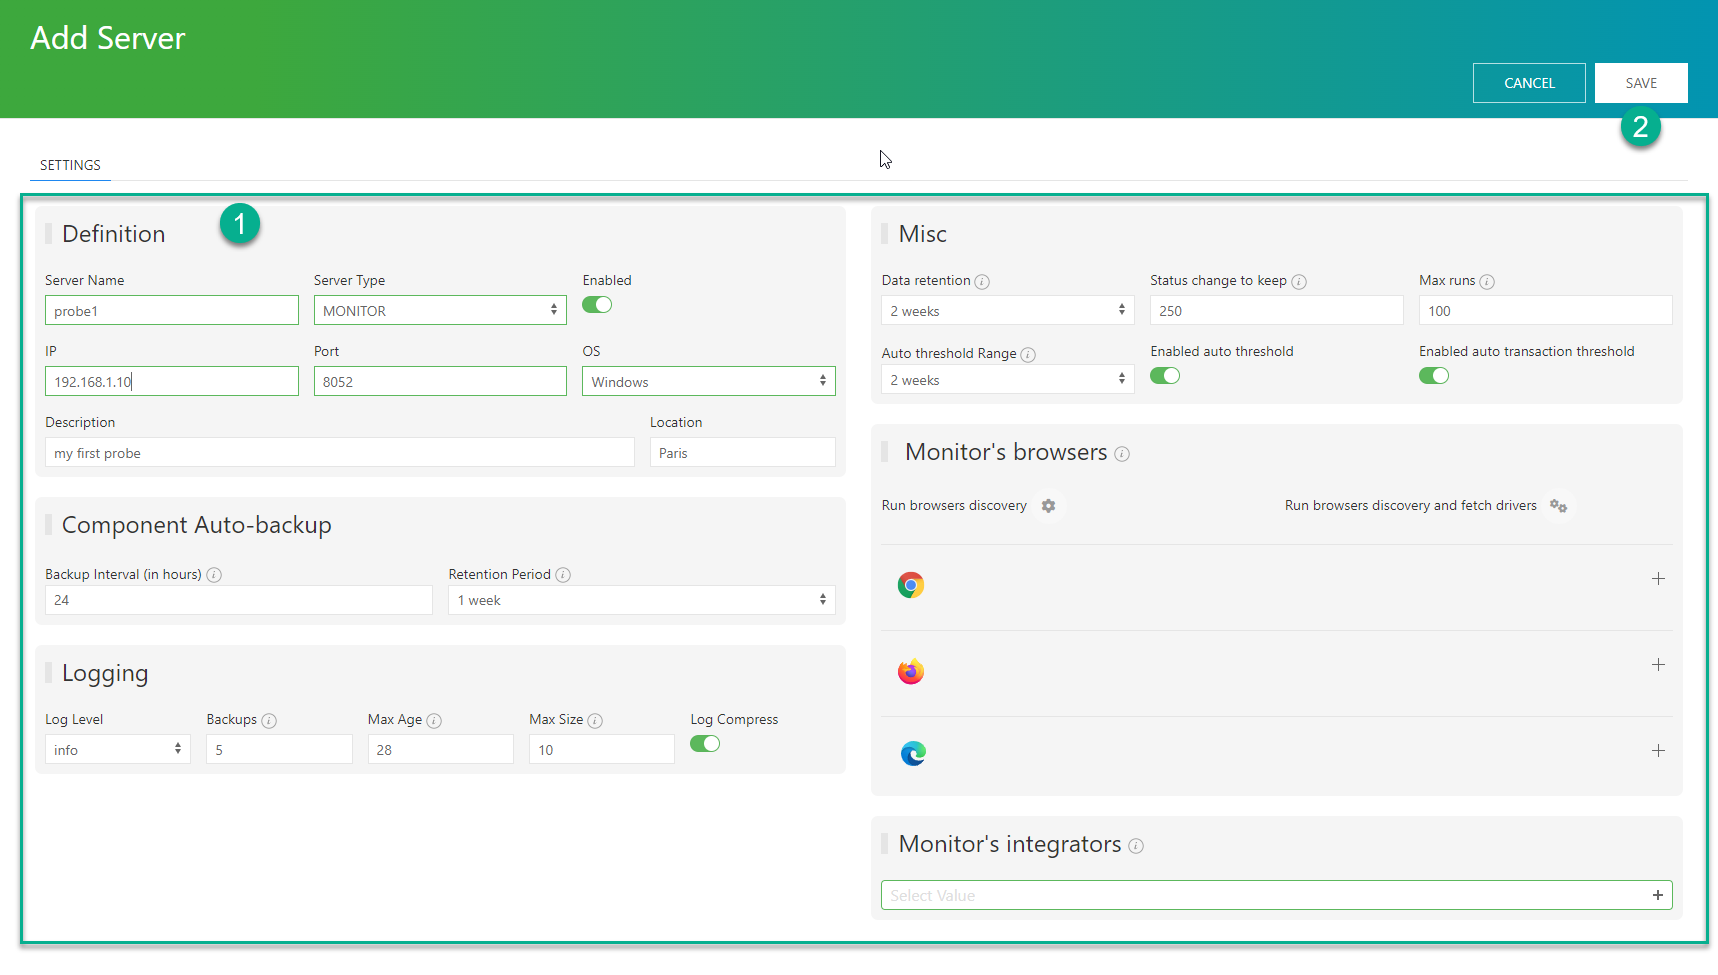
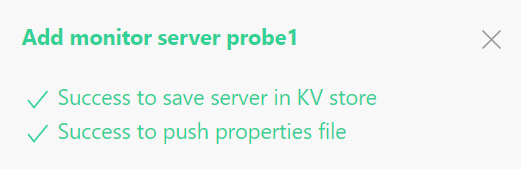
- The MNS server should appear in the list
At the right bottom of the page, you should see the below status
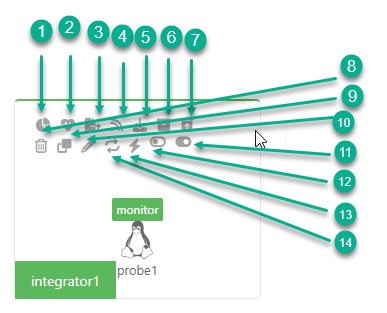
Once a MNS component has been defined. Below are the available operations you can peform on this server.
Available operations
-
Display the component system metrics charts. Go to uptime.
-
Check the component uptime. Go to uptime.
-
Push setting to the component. Go to push settings.
-
Live view the component execution. Go to live view.
-
Download the component’s run files. Go to download run files.
-
Backup the component’s KV store. Go to backup KV store.
-
Reinitialize the component’s KV store. Go to reinitialize KV store.
-
Delete the component. Go to delete component.
-
Duplicate the component. Go to edit component.
-
Edit the component. Go to edit component.
-
Reload component SSL certificates folder. Go to edit component.
-
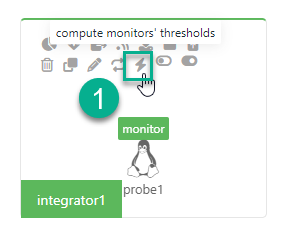
Compute monitor’s thresholds component (available only for component of type monitor probe). Go to compute threshold monitor component.
-
Disablethe component. Go to edit component.
-
Enable the component. Go to enable component.
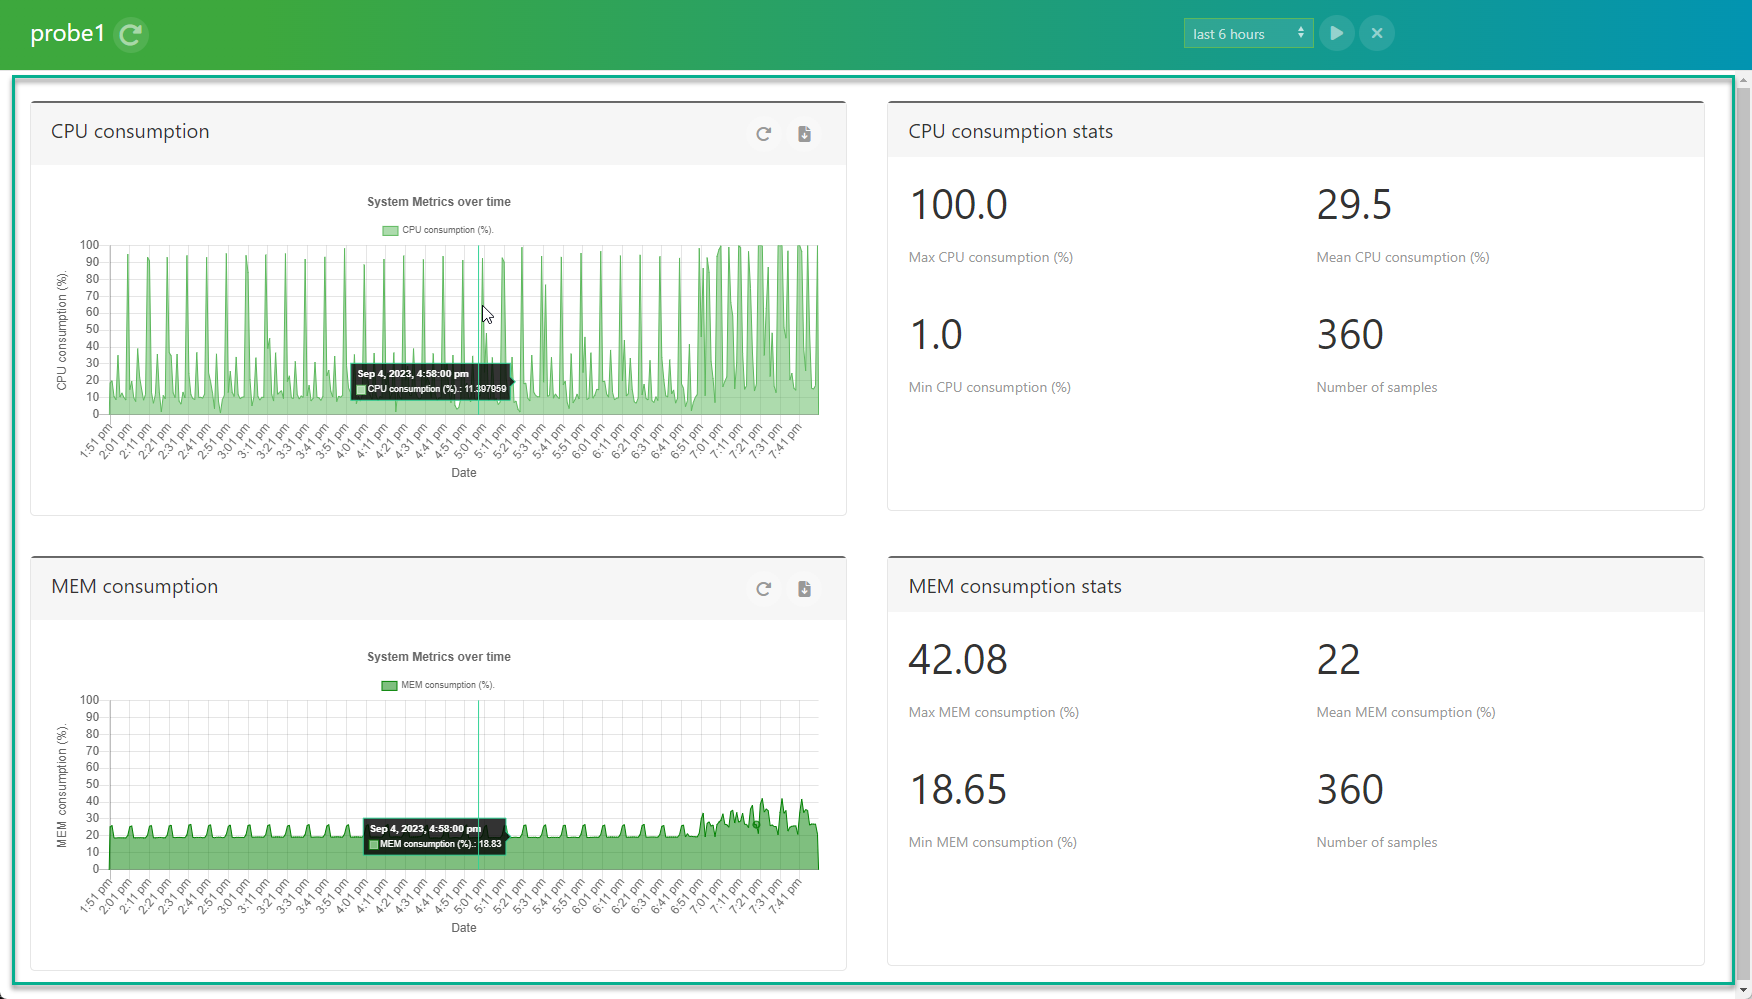
component metrics
- hover on the server and click on the uptime icon
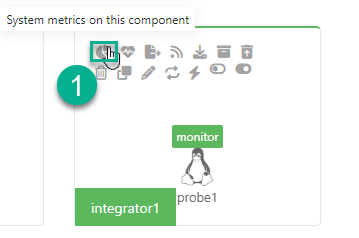
Some system metrics statistics should display (CPU, Memory, CPU I/O Wait, TCP Sockets).
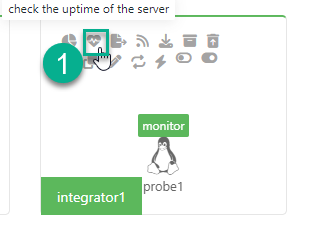
component uptime
- hover on the server and click on the uptime icon
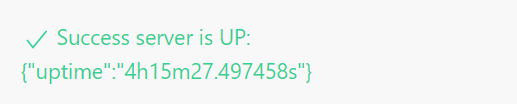
At the right bottom of the page, you should see the below status
Push settings
- hover on the component and click on the push icon
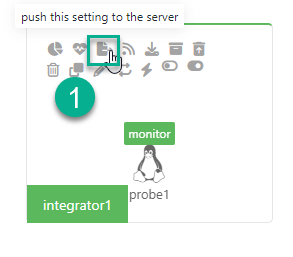
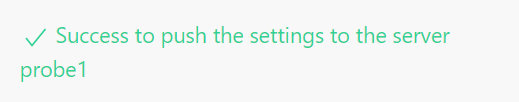
At the right bottom of the page, you should see the below status
Live view
- hover on the component and click on the live view icon
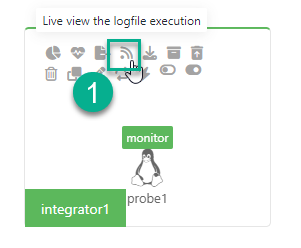
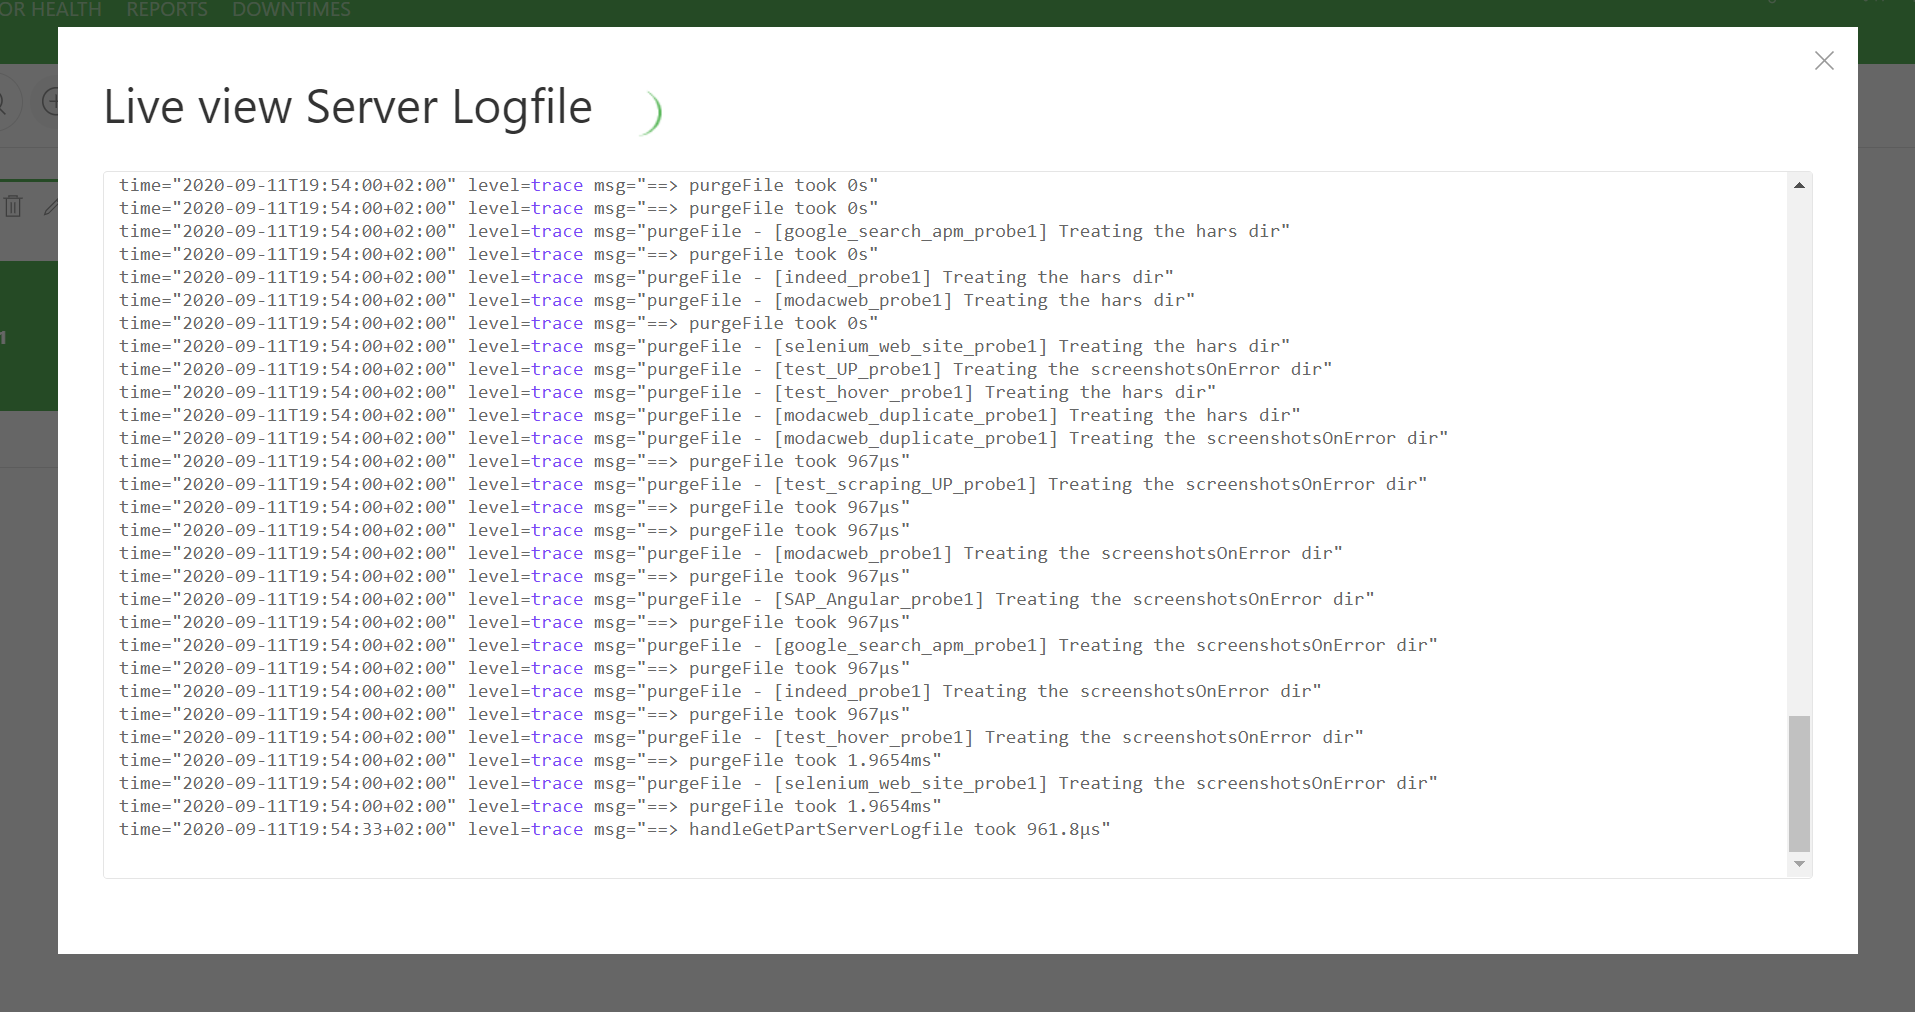
- the live view execution of the component is displayed in the modal windows
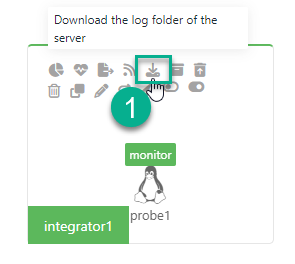
Download run files
- hover on the component and click on the download icon
At the bottom right, upon success you should see the below notification:
Backup KV store
- hover on the component and click on the backup icon
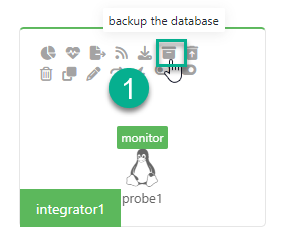
At the bottom right, upon success you should see the below notification:
Reinitialize KV store
- hover on the component and click on the reinitialize icon
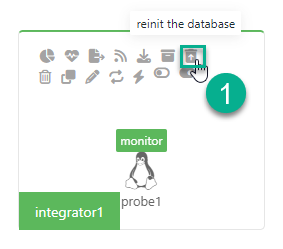
- click on the confirm button
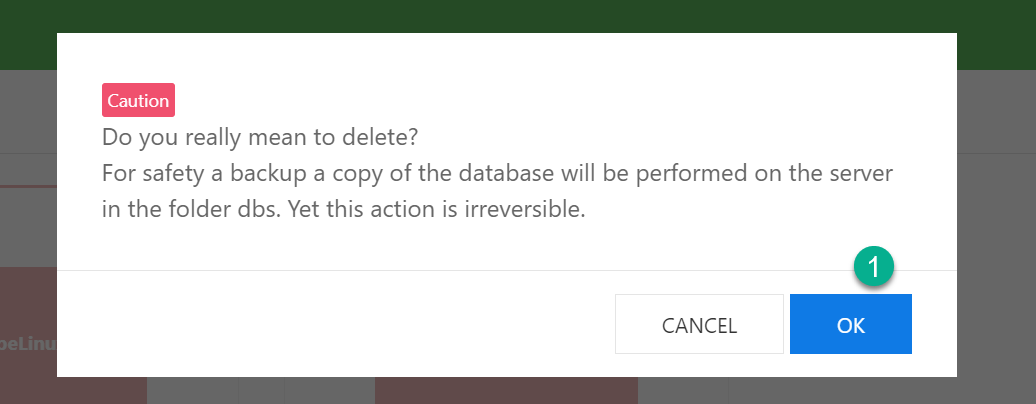
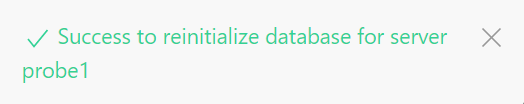
At the bottom right, upon success you should see the below notification:
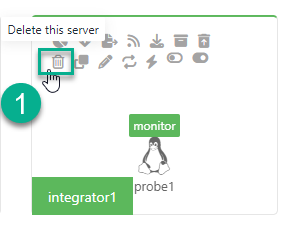
Delete component
- hover on the component and click on the delete icon
- click on the confirm button
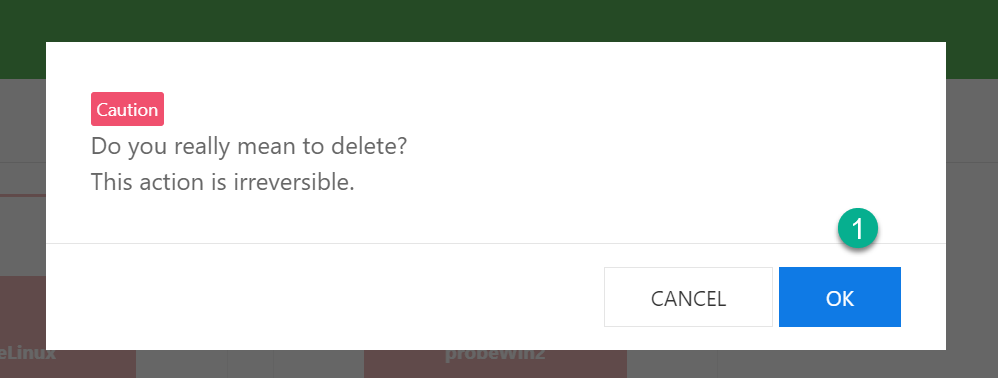
- click on the confirm warning button: depending on whether the server is reachable or not or the server’s KV store contains data or not, you see one of the below warning message:
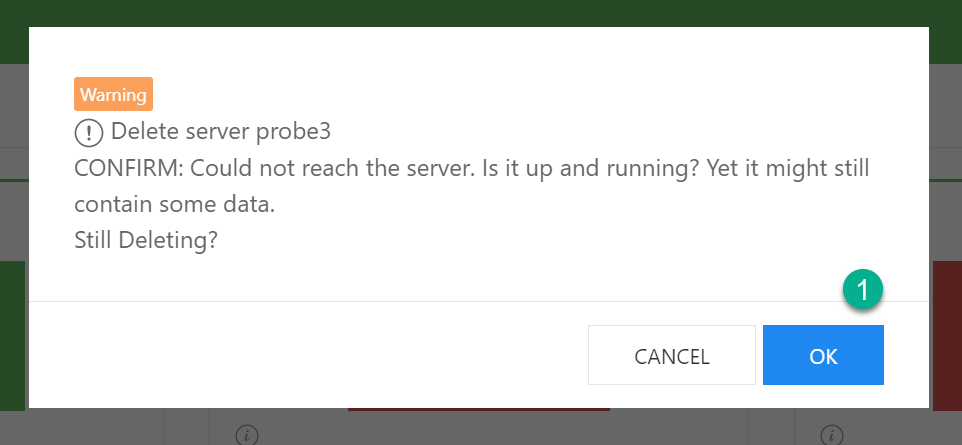
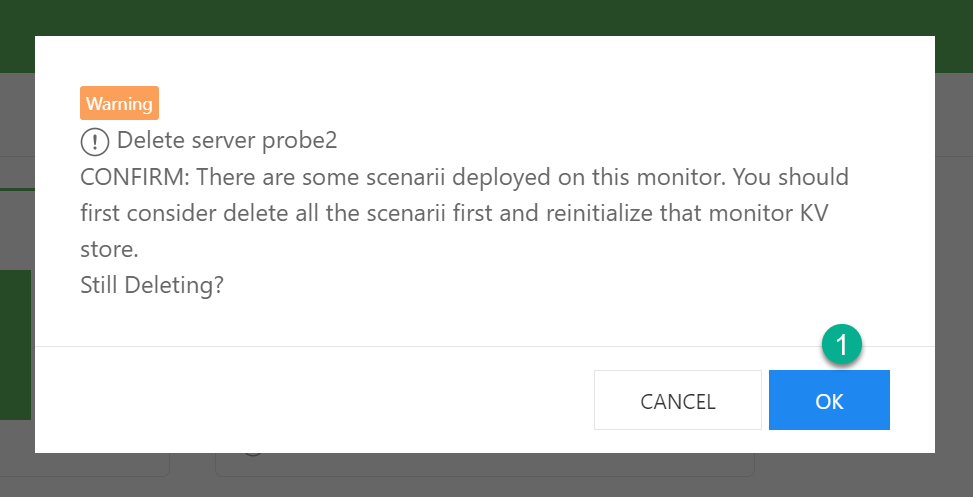
At the bottom right, upon success you should see the below notification:

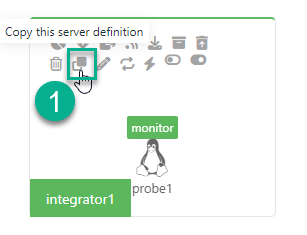
Duplicate component
- Click on the duplicate icon
Edit component
- Click on the pencil icon
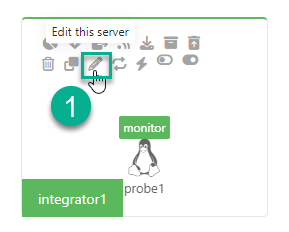
- Edit the component name, state (enabled/disabled), description.
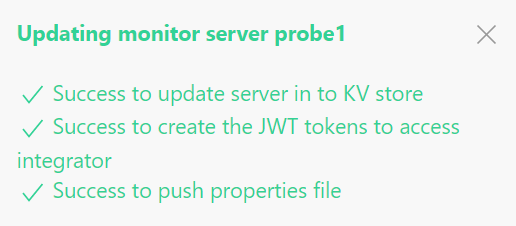
At the bottom right, upon success you should see the below notification:
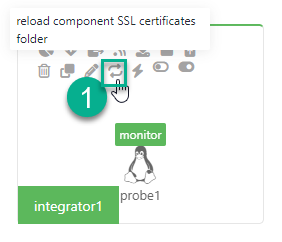
Reload SSL folder component
- Click on the reload ssl folder icon
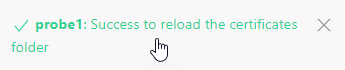
At the bottom right, upon success you should see the below notification:
Compute threshold monitor component
- Click on the reload ssl folder icon
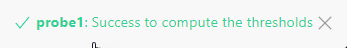
At the bottom right, upon success you should see the below notification:
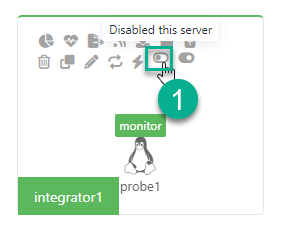
Disable component
- Click on the disable icon
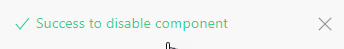
At the bottom right, upon success you should see the below notification:
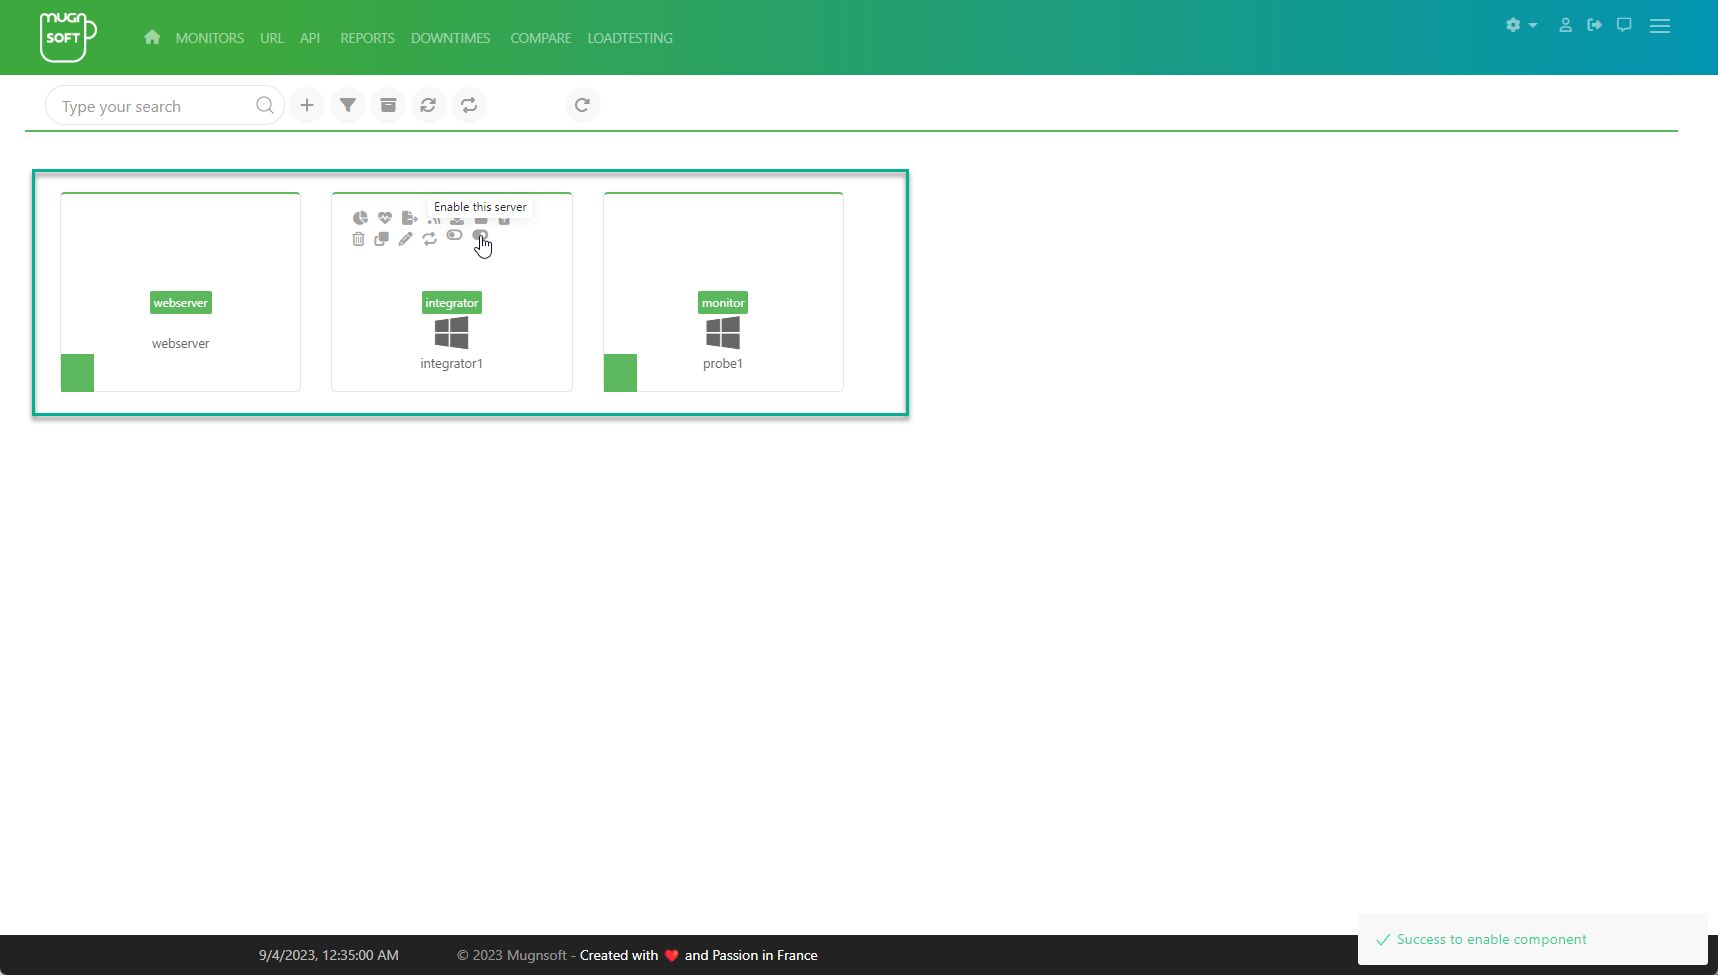
Enable component
- Click on the enable icon
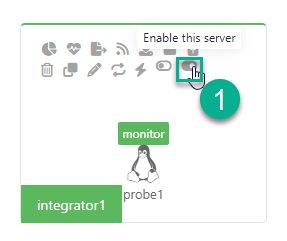
At the bottom right, upon success you should see the below notification:
Filter components
We can filter components based on their state (enabled/disabled) or their name.
- Click on the given button to toggle the filter
- Click on any of these value to filter based on the state
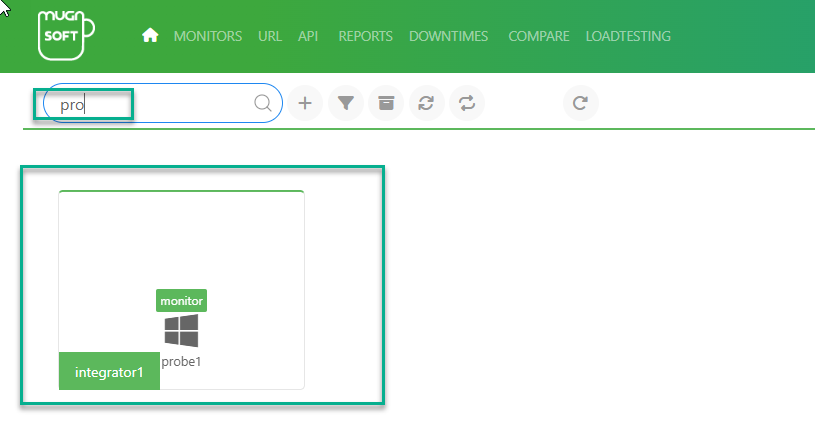
- Type in case sensitive pattern (part of the servername) and type enter
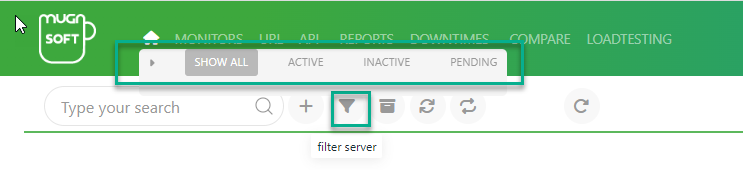
- Type in “pro” and type enter
- Components matching this criteria should appears in the list