Monitor HTTP API
The Mugnsoft Monitor REST API provides comprehensive monitoring capabilities for web applications, APIs, network services, and infrastructure. Version 2.0.0
Introduction
The Monitor API allows you to:
- Create and manage various types of monitors (HTTP/HTTPS, API, TCP, Ping, DNS, SNMP, Database, System metrics)
- Execute monitors on-demand or schedule them via cron expressions
- Retrieve performance metrics and historical data
- Configure alerting and notifications (Email, Slack, Microsoft Teams, PagerDuty)
- Manage users and authentication
- Export and analyze monitoring data
Base URL: https://<monitor-ip>:8051
Protocol: HTTPS with mTLS (mutual TLS)
Authentication
The Mugnsoft Monitor API uses JWT (JSON Web Token) authentication with RS256 algorithm (RSA signature with SHA-256).
Login
curl -k -X POST https://192.168.1.100:8051/login \
  -H "Content-Type: application/json" \
  -d '{
    "username": "admin",
    "password": "your_password"
  }'
Response (200 OK):
{
  "code": 200,
  "expire": "2025-10-11T12:00:00Z",
  "token": "eyJhbGciOiJSUzI1NiIsInR5cCI6IkpXVCJ9..."
}
Token Validity:
- Standard login (
/login): 24 hours - Component login (
/loginComponent): 60 days - Long-term component login (
/loginComponent1Year): 1 year - Extended component login (
/loginComponent15Years): 15 years
Using the JWT Token
Include the JWT token in the Authorization header for all authenticated requests:
Authorization: Bearer eyJhbGciOiJSUzI1NiIsInR5cCI6IkpXVCJ9...
Token Refresh
curl -k -X GET https://192.168.1.100:8051/refresh_token \
  -H "Authorization: Bearer <your_current_token>"
Monitor Types
1. Web UI Monitors (Selenium-based)
Monitor complete user journeys using browser automation (Chrome, Firefox, Edge).
Database: exec
Capabilities:
- Execute multi-step transactions
- Capture screenshots and videos
- Generate HAR files
- Measure page load times and transaction times
- Support for TOTP-based MFA
- Vault integration for secure credential management
2. HTTP/HTTPS URL Monitors
Simple HTTP/HTTPS GET requests with response time measurement.
Database: url
Capabilities:
- HTTP/HTTPS URL checks
- Response time measurement
- Status code validation
- Pattern matching in response body
- SSL certificate expiry tracking
3. API Monitors
RESTful API endpoint monitoring with advanced validation.
Database: api
Capabilities:
- GET/POST/PUT/DELETE methods
- Request headers and body
- Basic authentication & client certificates
- JSON/XML response parsing
- Regex pattern matching with named groups
- Numeric value extraction and threshold comparison
4. TCP Port Monitors
TCP connectivity checks to specific host:port combinations.
Database: tcp
5. ICMP Ping Monitors
Network latency and availability monitoring using ICMP echo.
Database: ping
6. DNS/Nslookup Monitors
DNS resolution monitoring and validation.
Database: nslookup
7. SNMP Monitors
SNMP device monitoring (v1, v2c, v3).
Database: snmp
8. Database Query Monitors
Database query execution and result validation (MySQL, PostgreSQL, Microsoft SQL Server).
Database: db
9. System Metrics Monitors
Local system resource monitoring (CPU, Memory, Swap, Disk, Load).
Database: sys
Common Patterns
Schedule Values
Monitors can be scheduled using predefined intervals or custom cron expressions:
| Schedule ID | Cron Expression | Description |
|---|---|---|
1MIN |
* * * * * |
Every minute |
5MIN |
*/5 * * * * |
Every 5 minutes |
10MIN |
*/10 * * * * |
Every 10 minutes |
20MIN |
*/20 * * * * |
Every 20 minutes |
30MIN |
*/30 * * * * |
Every 30 minutes |
60MIN |
0 * * * * |
Every hour |
Monitor States
on- Monitor is enabled and running according to scheduleoff- Monitor is disabled (not executed)
Monitor Status
OK- Check passed, no issuesMINOR- Minor threshold exceededMAJOR- Major threshold exceededCRITICAL- Critical threshold exceededDOWN- Service/endpoint is unreachableERROR- Execution error occurredEXCEPTION- Configuration or system exceptionDOWNTIME- Monitor is in scheduled downtime
Timestamp Format
All timestamps use Unix milliseconds (epoch time in milliseconds).
Example: 1728565200000 = 2025-10-10 12:00:00 UTC
API Endpoints Reference
Monitor Management
Get All Monitors
curl -k -X GET https://192.168.1.100:8051/monitors \
  -H "Authorization: Bearer <token>"
Returns all monitors across all types and schedules.
Get Monitor Details
curl -k -X POST https://192.168.1.100:8051/getMonitorDetails \
  -H "Authorization: Bearer <token>" \
  -H "Content-Type: application/json" \
  -d '{
    "type": "url",
    "name": "monitor_name",
    "sched": "5MIN"
  }'
Run Monitor On-Demand
curl -k -X GET "https://192.168.1.100:8051/monitor/run/homepage_check/show" \
  -H "Authorization: Bearer <token>"
Path Parameters:
title- Monitor nameshow- Output mode (showfor full output,hidefor minimal output)
Enable/Disable Monitor
# Enable
curl -k -X POST https://192.168.1.100:8051/exec/enable/5MIN/homepage_check \
  -H "Authorization: Bearer <token>"

# Disable
curl -k -X POST https://192.168.1.100:8051/exec/disable/5MIN/homepage_check \
  -H "Authorization: Bearer <token>"
Delete Monitor
curl -k -X DELETE https://192.168.1.100:8051/delete/exec/5MIN/monitor_name \
  -H "Authorization: Bearer <token>"
URL Monitors
Create URL Monitor
curl -k -X POST https://192.168.1.100:8051/url/create \
  -H "Authorization: Bearer <token>" \
  -H "Content-Type: application/json" \
  -d '{
    "name": "homepage_check",
    "display_name": "Homepage Availability",
    "url": "https://example.com",
    "sched": "5MIN",
    "schedCron": "*/5 * * * *",
    "state": "on",
    "probe": "probe1",
    "location": "datacenter1",
    "tags": "[production,web]",
    "timeout": "10",
    "retries": "2",
    "threshCri": "5000",
    "threshMaj": "3000",
    "threshMin": "2000",
    "notifyStatus": "on",
    "notifyAfter": "3",
    "emailOnF": "true",
    "emailR": "ops@example.com"
  }'
Key Field Descriptions:
name- Unique monitor identifier (required)display_name- Human-readable name (required)url- Target URL (required)sched- Schedule identifier (required)state-onoroff(required)probe- Probe/monitor component name (required)tags- Comma-separated tags in bracketstimeout- Request timeout in secondsretries- Number of retry attemptsthreshCri/threshMaj/threshMin- Response time thresholds in millisecondsnotifyAfter- Number of consecutive failures before alertingemailOnF- Send email on failure (true/false)emailR- Email recipients (comma-separated)
Update URL Monitor
curl -k -X POST https://192.168.1.100:8051/url/update/5MIN/homepage_check \
  -H "Authorization: Bearer <token>" \
  -H "Content-Type: application/json" \
  -d '{...}'
API Monitors
Create API Monitor
curl -k -X POST https://192.168.1.100:8051/api/create \
  -H "Authorization: Bearer <token>" \
  -H "Content-Type: application/json" \
  -d '{
    "name": "user_api_check",
    "display_name": "User API Endpoint",
    "api": "https://api.example.com/users",
    "typeApi": "GET",
    "sched": "5MIN",
    "schedCron": "*/5 * * * *",
    "state": "on",
    "probe": "probe1",
    "tags": "[api,production]",
    "timeout": "5",
    "pattern": "\"total\":(\\d+)",
    "matchGroupName": "total",
    "matchIndex": "1",
    "patternComp": "number >",
    "patternCompValCri": "1000",
    "headers": "Content-Type:application/json,X-API-Key:secret",
    "body": "{\"filter\":\"active\"}"
  }'
Additional Fields:
typeApi- HTTP method:GET,POST,PUT,DELETEpattern- Regex pattern to extract values from responsematchGroupName- Named capture group in regexpatternComp- Comparison operator:number >,number <,number ==,string ==,string containsheaders- Comma-separated headers (format:Key:Value,Key2:Value2)body- Request body (for POST/PUT)basicAuthUser/basicAuthPwd- HTTP Basic AuthenticationclientCert/clientCertKey- Client certificate paths for mTLS
TCP Port Monitors
Create TCP Monitor
curl -k -X POST https://192.168.1.100:8051/tcp/create \
  -H "Authorization: Bearer <token>" \
  -H "Content-Type: application/json" \
  -d '{
    "name": "ssh_port_check",
    "display_name": "SSH Port 22",
    "ip": "192.168.1.100",
    "port": "22",
    "sched": "5MIN",
    "schedCron": "*/5 * * * *",
    "state": "on",
    "probe": "probe1",
    "tags": "[infrastructure,ssh]"
  }'
ICMP Ping Monitors
Create Ping Monitor
curl -k -X POST https://192.168.1.100:8051/ping/create \
  -H "Authorization: Bearer <token>" \
  -H "Content-Type: application/json" \
  -d '{
    "name": "gateway_ping",
    "display_name": "Gateway Connectivity",
    "ip": "192.168.1.1",
    "sched": "1MIN",
    "schedCron": "* * * * *",
    "state": "on",
    "probe": "probe1",
    "tags": "[network,gateway]"
  }'
DNS/Nslookup Monitors
Create Nslookup Monitor
curl -k -X POST https://192.168.1.100:8051/nslookup/create \
  -H "Authorization: Bearer <token>" \
  -H "Content-Type: application/json" \
  -d '{
    "name": "dns_example_com",
    "display_name": "DNS Resolution - example.com",
    "domain": "example.com",
    "recordType": "A",
    "expectedValue": "93.184.216.34",
    "dnsServer": "8.8.8.8",
    "sched": "5MIN",
    "state": "on"
  }'
Field Descriptions:
recordType- DNS record type:A,AAAA,CNAME,MX,TXT,NS,SOAexpectedValue- Expected DNS response valuednsServer- DNS server to query (optional)
SNMP Monitors
Create SNMP Monitor (v2c)
curl -k -X POST https://192.168.1.100:8051/snmp/create \
  -H "Authorization: Bearer <token>" \
  -H "Content-Type: application/json" \
  -d '{
    "name": "router_cpu",
    "display_name": "Router CPU Usage",
    "ip": "192.168.1.1",
    "port": "161",
    "version": "v2c",
    "community": "public",
    "snmpOid": "1.3.6.1.4.1.9.9.109.1.1.1.1.7.1",
    "sched": "5MIN",
    "state": "on",
    "threshCri": "90",
    "threshMaj": "75",
    "threshMin": "60"
  }'
Create SNMPv3 Monitor
curl -k -X POST https://192.168.1.100:8051/snmp/create \
  -H "Authorization: Bearer <token>" \
  -H "Content-Type: application/json" \
  -d '{
    "name": "router_cpu_v3",
    "display_name": "Router CPU (SNMPv3)",
    "ip": "192.168.1.1",
    "port": "161",
    "version": "v3",
    "v3Username": "snmpuser",
    "v3SecurityLevel": "authPriv",
    "v3AuthProtocol": "SHA",
    "v3AuthPassword": "authpass123",
    "v3PrivProtocol": "AES",
    "v3PrivPassword": "privpass456",
    "snmpOid": "1.3.6.1.4.1.9.9.109.1.1.1.1.7.1",
    "sched": "5MIN",
    "state": "on"
  }'
SNMPv3 Field Descriptions:
v3SecurityLevel- Security level:noAuthNoPriv,authNoPriv,authPrivv3AuthProtocol- Authentication protocol:MD5,SHA,SHA224,SHA256,SHA384,SHA512v3PrivProtocol- Privacy protocol:DES,AES,AES192,AES256
Database Query Monitors
Create Database Monitor
curl -k -X POST https://192.168.1.100:8051/db/create \
  -H "Authorization: Bearer <token>" \
  -H "Content-Type: application/json" \
  -d '{
    "name": "user_count_check",
    "display_name": "Active Users Count",
    "dbType": "mysql",
    "dbIp": "db.example.com",
    "dbPort": "3306",
    "dbUser": "monitor_user",
    "dbPwd": "secure_password",
    "dbDb": "production",
    "query": "SELECT COUNT(*) as user_count FROM users WHERE status=\"active\"",
    "sched": "10MIN",
    "state": "on"
  }'
Field Descriptions:
dbType- Database type:mysql,postgres,mssql(required)query- SQL query to execute (required)
System Metrics Monitors
Create System Monitor
curl -k -X POST https://192.168.1.100:8051/sys/create \
  -H "Authorization: Bearer <token>" \
  -H "Content-Type: application/json" \
  -d '{
    "name": "local_cpu_check",
    "display_name": "Local CPU Usage",
    "sched": "5MIN",
    "schedCron": "*/5 * * * *",
    "state": "on",
    "probe": "probe1",
    "threshCri": "90",
    "threshMaj": "75",
    "threshMin": "60"
  }'
Collected Metrics:
- CPU utilization (%)
- Memory usage (%)
- Swap usage (%)
- Disk usage (%)
- System load average (1min, 5min, 15min)
Data & Reporting
Get Monitor Timeline Data
curl -k -X POST "https://192.168.1.100:8051/timelineGraph/url/homepage_check/1728565200000/1728651600000" \
  -H "Authorization: Bearer <token>"
Path Parameters:
dbname- Database name:exec,url,api,tcp,ping,nslookup,snmp,db,syskey- Monitor namestartTime- Unix timestamp (milliseconds)endTime- Unix timestamp (milliseconds)
Get Performance Graph Data
curl -k -X POST "https://192.168.1.100:8051/histGraph/api/user_count_api/1728565200000/1728651600000" \
  -H "Authorization: Bearer <token>"
Returns response time/performance metrics over time.
Get Monitor Trend
curl -k -X GET "https://192.168.1.100:8051/getTrend/url/homepage_check" \
  -H "Authorization: Bearer <token>"
Returns trend data (24h, 7d, 4w).
User Management
Get All Users
curl -k -X GET https://192.168.1.100:8051/api/users \
  -H "Authorization: Bearer <token>"
Create User
curl -k -X POST https://192.168.1.100:8051/api/users \
  -H "Authorization: Bearer <token>" \
  -H "Content-Type: application/json" \
  -d '{
    "username": "newuser",
    "password": "securepassword123",
    "fullname": "New User",
    "email": "newuser@example.com",
    "group": "user",
    "enabled": "true"
  }'
Field Descriptions:
group- User group:admin,user,readonlyenabled- Account status:trueorfalse
Update User
curl -k -X PATCH https://192.168.1.100:8051/api/users \
  -H "Authorization: Bearer <token>" \
  -H "Content-Type: application/json" \
  -d '{
    "username": "existinguser",
    "password": "newpassword",
    "group": "admin"
  }'
Delete User
curl -k -X DELETE https://192.168.1.100:8051/api/users/username \
  -H "Authorization: Bearer <token>"
Settings & Configuration
Get Settings
curl -k -X GET https://192.168.1.100:8051/setting \
  -H "Authorization: Bearer <token>"
Returns probe configuration settings.
Update Settings
curl -k -X POST https://192.168.1.100:8051/updateSetting \
  -H "Authorization: Bearer <token>" \
  -H "Content-Type: application/json" \
  -d '{
    "logLevel": "info",
    "concurrencyLimit": "150",
    "dataRetention": "168"
  }'
Configurable Settings:
logLevel- Logging level:trace,debug,info,warn,errorconcurrencyLimit- Maximum concurrent monitor executionsdataRetention- Data retention in hoursautoThreshold- Enable automatic threshold calculation:true/falseautoThresholdRange- Hours to analyze for auto-threshold:24,168,720
Configure SMTP Settings
curl -k -X POST https://192.168.1.100:8051/setsmtpvault \
  -H "Authorization: Bearer <token>" \
  -H "Content-Type: application/json" \
  -d '{
    "smtpHost": "smtp.gmail.com",
    "smtpPort": "587",
    "smtpUser": "alerts@example.com",
    "smtpPassword": "app_password",
    "smtpFrom": "Mugnsoft Monitor <alerts@example.com>",
    "smtpEnabled": "true"
  }'
Database Operations
Get Database Statistics
curl -k -X GET https://192.168.1.100:8051/v1/db/exec/stats \
  -H "Authorization: Bearer <token>"
Returns bucket names and key counts.
Get All Buckets
curl -k -X GET https://192.168.1.100:8051/v1/db/exec/buckets \
  -H "Authorization: Bearer <token>"
Backup Database
curl -k -X POST https://192.168.1.100:8051/backupDatabase \
  -H "Authorization: Bearer <token>" \
  -H "Content-Type: application/json" \
  -d '{
    "database": "exec"
  }'
Certificate Management
Reload Certificates
curl -k -X GET https://192.168.1.100:8051/reloadCertificates \
  -H "Authorization: Bearer <token>"
Reloads TLS certificates from the certificates folder.
Get Certificate
curl -k -X GET https://192.168.1.100:8051/getCert -o monitor.crt
Downloads the monitor’s public certificate (PEM format). No authentication required.
Utility Endpoints
Health Check
curl -k https://192.168.1.100:8051/ping
Response:
{
  "message": "pong"
}
No authentication required. Use for health checks.
Get Uptime
curl -k -X GET https://192.168.1.100:8051/uptime \
  -H "Authorization: Bearer <token>"
Get System Metrics (Prometheus format)
curl -k https://192.168.1.100:8051/api/metrics
No authentication required. Returns system metrics in Prometheus exposition format.
Response Codes
Success Codes
| Code | Status | Description |
|---|---|---|
| 200 | OK | Request successful |
| 201 | Created | Resource created successfully |
Client Error Codes
| Code | Status | Description |
|---|---|---|
| 400 | Bad Request | Invalid request format or parameters |
| 401 | Unauthorized | Missing or invalid authentication token |
| 403 | Forbidden | Insufficient permissions |
| 404 | Not Found | Resource not found |
| 409 | Conflict | Resource already exists |
Server Error Codes
| Code | Status | Description |
|---|---|---|
| 500 | Internal Server Error | Server error occurred |
| 503 | Service Unavailable | Service temporarily unavailable |
Best Practices
Authentication
- Store JWT tokens securely
- Refresh tokens before expiry
- Use component login for long-running integrations
- Implement token rotation for production systems
Scheduling
- Use appropriate intervals based on criticality:
- Critical services: 1MIN
- Important services: 5MIN
- Regular checks: 10MIN or 30MIN
- Avoid over-monitoring to reduce load
Thresholds
- Enable
autoThresholdfor dynamic threshold calculation - Set realistic thresholds based on baseline performance
- Use 3-tier thresholds: MINOR (warning), MAJOR (significant), CRITICAL (severe)
Notifications
- Configure
notifyAfterto avoid alert fatigue (e.g., notify after 3 consecutive failures) - Use different channels for different severity levels
- Test notification channels before production deployment
Tags
- Use consistent tag naming conventions
- Implement hierarchical tags:
[environment_location_type] - Examples:
[prod_us_web],[staging_eu_api],[prod_dc1_database]
Swagger Documentation
Interactive API documentation is available via Swagger UI:
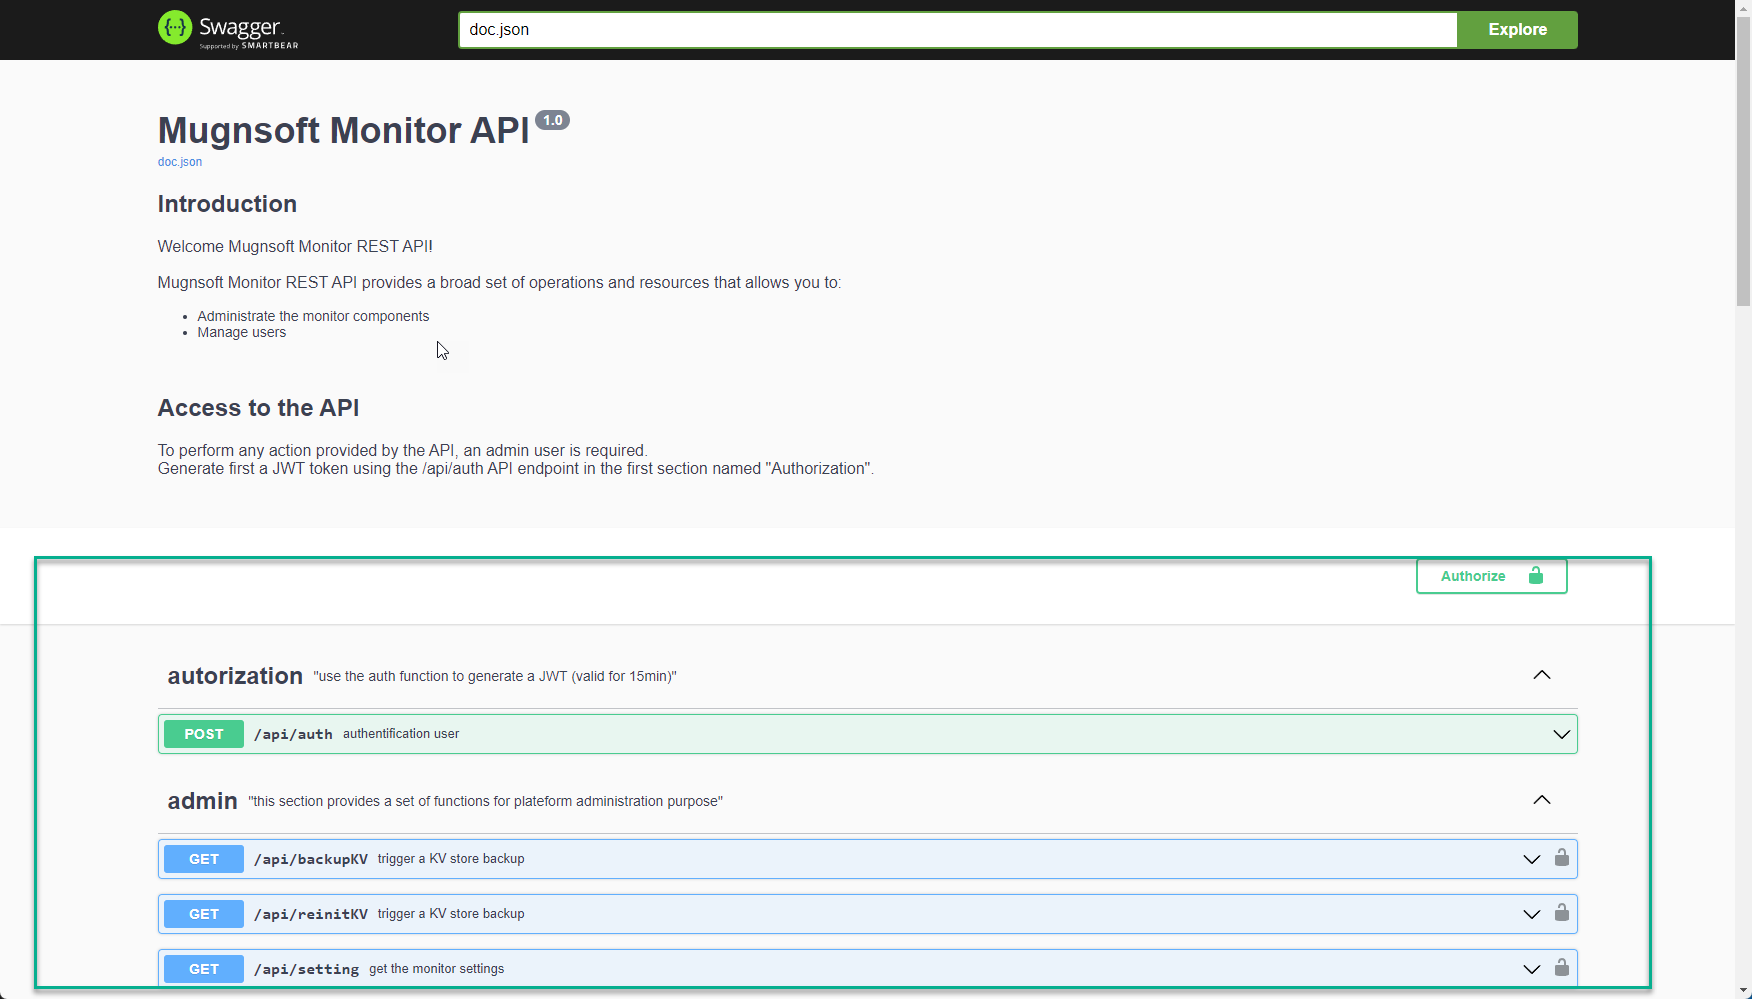
Access the Swagger UI at: https://<monitor-ip>:8051/docs/index.html
Additional Resources
- System Metrics:
https://<monitor-ip>:8051/api/metrics(Prometheus format) - Health Check:
https://<monitor-ip>:8051/ping - Installation Guide: Installing Mugnsoft
- Main Website: Mugnsoft