Events page
The Events page is the triage screen: one line per monitor that is currently in a non-OK state, across every probe and every Integrator, with the root-cause analysis folded in so a single outage reads as one incident instead of a dozen alerts.
Open it from the left navigation, or go straight to /web/html/layout.html#/events.
Where the data comes from
The Webserver stores no events of its own. Each request to /events fans out in parallel to every enabled Integrator, asks each one for its current event list, and merges the answers into a single table.
Note:
Three things follow from that design:
| Behaviour | Detail |
|---|---|
| Scoped to your permissions | The Webserver resolves your account’s tags and applications and passes them to each Integrator, which filters before answering. An account entitled to everything is sent an “unrestricted” flag instead, so monitors carrying no tags at all are still returned to it. |
| Partial results are reported | If an Integrator does not answer, the page still renders what the others returned and shows a warning banner naming the ones that failed. Numbers on screen are then incomplete, not wrong. |
| A failed refresh never blanks the table | When a refresh fails, the previous rows stay on screen with an error message. Emptying the table would state that nothing is wrong, which is the one thing a failed refresh cannot establish. |
The page refreshes itself every 30 seconds. Background ticks are skipped while the browser tab is hidden — the refresh fans out to every Integrator and rebuilds the whole table, which is not worth doing for a tab nobody is looking at. The refresh button forces an immediate reload.
Reading the table
| Column | What it shows |
|---|---|
| Status | The monitor’s current status, as a coloured badge. The cell also carries a coloured left rail matching the badge. |
| RCA | The event’s role in an incident — root, symptom or —. Only present when correlation is enabled; see Root-cause analysis below. |
| Timestamp | When the event was recorded. |
| Since | How long the monitor has been in this status (“14m ago”), with the exact time in the tooltip. |
| Type | Monitor type, as the same coloured chip used on the /all page. |
| Name | Monitor short name. |
| Probe | Probe that executed the check, with its location in brackets when set. |
| Description | The message the probe reported — the error text, the failing assertion, the breached threshold. |
| Host / Metric | Host the event concerns, and the metric when the type has one (cpu, missing, …). |
| Actions | Per-row shortcuts — see Row actions. |
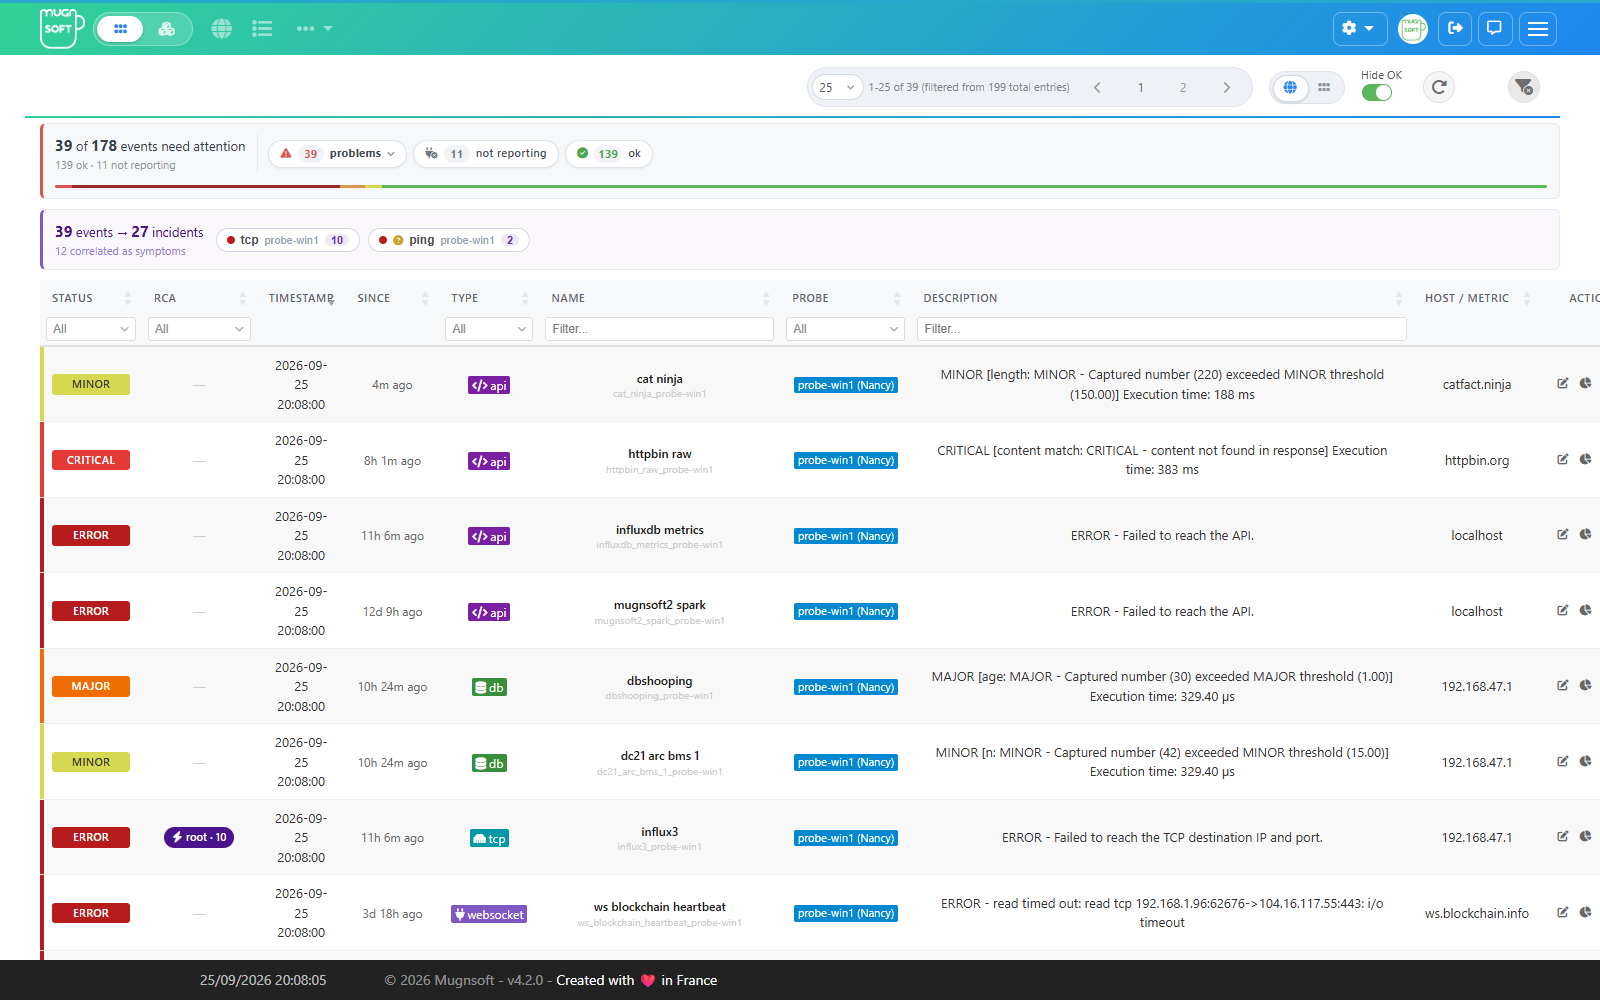
Rows are sorted newest first by default. Click any header to re-sort; the Actions column is not sortable.
Statuses
Statuses are ordered by severity in the summary panel and in the status filter:
| Status | Meaning |
|---|---|
CRITICAL |
Threshold breached at the critical level. |
ERROR |
The check itself failed — connection refused, DNS failure, assertion failed. |
MAJOR / MINOR |
Threshold breached at the major / minor level. |
EXCEPTION |
The monitor script raised an exception. |
TIMEOUT |
The check did not complete in time. |
CONFIG |
The monitor is misconfigured and could not run as written. |
OVERLAP |
A run started while the previous one was still going. |
DOWNTIME |
The monitor is inside a scheduled downtime window. |
OK |
Healthy. Hidden by default, see below. |
UNKNOWN / NO DATA |
No usable result. |
CRITICAL, ERROR, MAJOR, MINOR, EXCEPTION, TIMEOUT and CONFIG are the problem statuses — the ones the Problems chip selects.
The two views
The segmented control in the toolbar switches between two populations that are never mixed:
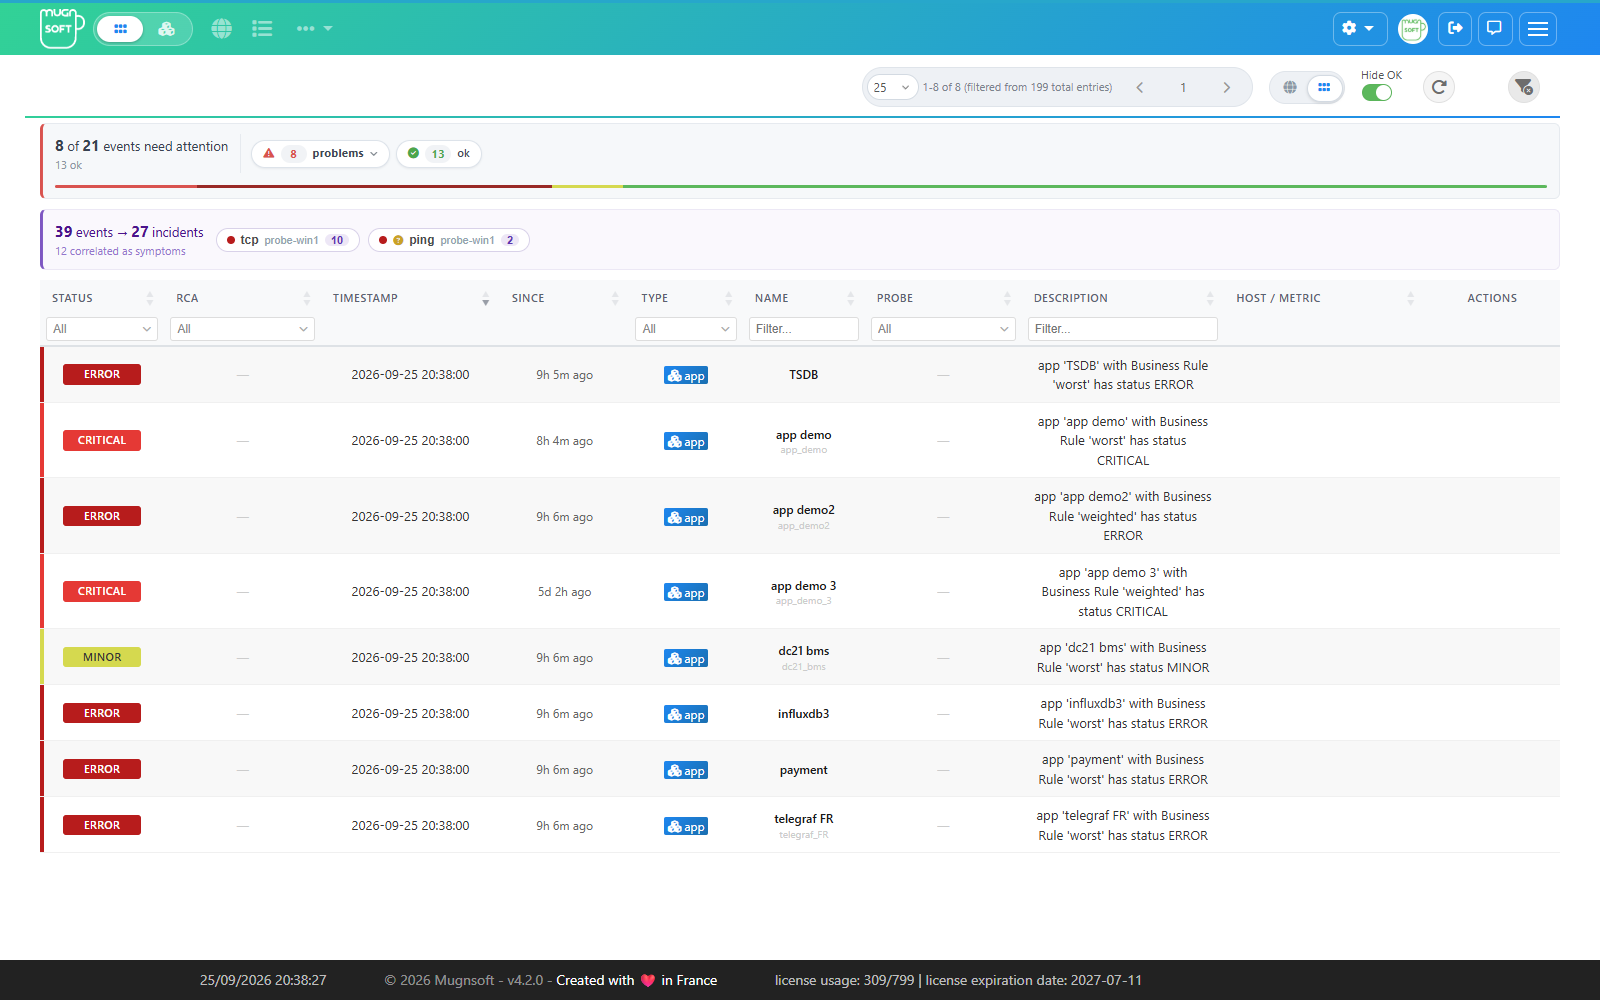
| View | Icon | Contents |
|---|---|---|
| All monitors | globe | The event stream — one row per monitor result. This is where the page opens. |
| Applications | grip | One row per application rollup. |
They are separate on purpose. An application rollup is a status the Webserver recomputes from its members, not something that happened: inside the stream it would restate rows already on the page, and being outside the causal model it can never be a root or a symptom.
Tip:
apps entitlement with no tags matching any monitor — would land on a permanently blank event view. The page detects that case (no events to show, applications available) and opens on the Applications view instead. It only ever does this before you touch the control yourself, and never in the opposite direction.
Filtering
Filters stack: each one narrows what the previous ones left.
Hide OK
A switch in the toolbar, on by default — the page is for things that need attention. Turn it off to see recovered monitors in the same list.
Status summary chips
The panel above the table counts the population by status and doubles as a filter.

- Click a status chip to filter to it; click the active one again to clear.
- The Problems chip selects every problem status present at once.
- The clear chip drops the status filter.
- The meter segments under the headline are clickable too, and answer to Enter and Space from the keyboard.
The chips and the Status column filter are the same filter shown twice — driving either one repaints the other, so they can never disagree.
Note:
OK from a chip while Hide OK is on would filter down to nothing. The explicit choice wins: the switch flips off, visibly, so you can see why the rows appeared.
The counts are taken over everything the view chooser and an isolated incident have left on the table — not over what Hide OK and the column filters removed. A chip that hid its own count would be unreadable.
Column filters
The second header row filters per column:
| Column | Control |
|---|---|
| Status, RCA, Type, Probe | Multi-select dropdown. Tick any number of values; Clear empties that column’s selection. |
| Name, Description | Free-text search, with a × to clear. |
The RCA dropdown offers a fixed vocabulary — root, symptom, independent — and matches on the row’s role rather than on the rendered text, which carries per-row counts and deltas.
Clear all filters
The filter-circle-xmark button in the toolbar resets everything at once: Hide OK off, back to the all-monitors view, incident isolation cleared, every column filter emptied.
Root-cause analysis
When at least one enabled Integrator runs the correlation engine, the page grows an RCA column and an incident strip. Both are hidden entirely when no Integrator has correlation on — an always-empty column would just be noise on the setups that never turned it on.
The correlation itself is computed by the Integrator, not by the Webserver. The rules — which types can explain which, how a candidate proves it concerns the same host and the same service, and how the look-back window works — are documented in Integrator, correlation engine.
The incident strip
The strip headlines the ratio the feature exists for:

24 events → 9 incidents 15 correlated as symptoms
Then one chip per incident, newest first, each carrying the cause’s type/metric, its probe, and how many events it explains. Two icons qualify a chip:
| Icon | Meaning |
|---|---|
| eye-slash | The root-cause monitor is not in the current view — filtered out by tags, or handled by another Integrator. The incident still forms; its header is synthesised from what the symptoms report about it. |
| question-mark | The grouping is not fully confirmed — at least one link in it rests on weaker evidence: either the hosts could not be compared, or they matched but the service could not be. The per-row RCA tooltips say which. Verify before acting on it. |
When nothing correlated, the strip says so plainly rather than disappearing.
The RCA column
| Cell | Meaning |
|---|---|
root · N |
Something points at this event: it is the probable root cause of N others. |
type/metric +Nm |
This event is a symptom: its cause is a type/metric check that broke N minutes earlier. |
— |
Independent — neither a cause nor a symptom. |
Hover any RCA cell for the full sentence: which monitor is the cause, how the link was established, and what remains unverified. A symptom whose link is unconfirmed is styled weaker and carries a question-mark icon.
The wording is deliberate. It says “Root cause” only where the evidence reaches the service, not merely the host:
| The cause is | Direct evidence — “Root cause” | Hedged — “Possible root cause” |
|---|---|---|
| a Sentinel Agent process check | the monitor was provisioned from that agent’s own configuration, or the vanished process owned the very port this check connects to | the two ports are known and different (a local proxy would explain it), or one side never reported a port |
an ordinary check (tcp, udp, db) |
the cause is a check against the very port this one uses, on the same host — that port was already unreachable | same two cases: a different port on that host broke, or the ports could not be compared |
Both kinds name the port, and the hedged tooltips say which port broke and which one this check actually uses — 1433 is down while this monitor needs 8086 is a very different situation from the two being the same port, and the sentence distinguishes them rather than leaving you to guess. Where only the host could be compared, the tooltip says so outright: that is precisely the evidence that over-groups a whole machine.
Isolating an incident
Click an incident chip, or any RCA cell in the table, to isolate that incident: the root and everything it explains stay, everything else drops away. Click again to clear.
Inside an isolated incident the table re-sorts oldest-first, because causal order is the useful reading order — the root broke first, so it reads at the top followed by what it took down.
Two behaviours are worth knowing:
- Isolating an incident while the Applications view is active switches back to the event stream. Rollups are never part of the causal graph, so an isolated incident would filter down to nothing. The control moves visibly rather than doing it behind your back.
- If the isolated incident disappears from a refresh — recovered, or filtered out by a tag change — the isolation is dropped instead of silently hiding every row.
Row actions
Actions depend on the event’s monitor type.
| Type | Actions |
|---|---|
eum |
Edit the monitor, open the full report (transactions, hourly and daily heat maps, HAR viewer, trend, screenshots), Run it now and follow the log. |
api, db, nslookup, ping, tcp, udp, url, snmp, wmi, sys |
Edit the monitor, open the report (threshold pills, pattern-group panels, status statistics, trend), Run it now. |
app, other |
None — an application rollup has no single monitor to act on. |
When the page is empty
| What you see | What it means |
|---|---|
| “No integrator is configured” banner | Events are collected by Integrators. Register and enable one — see Integrator. |
| “N integrator(s) not responding” banner | Those Integrators were unreachable or answered with an error. The rows on screen come from the others and are incomplete. Check the Integrator is running and reachable on its API port. |
| Empty table, no banner | Genuinely quiet — or everything is OK and Hide OK is on. Turn the switch off to confirm. |
| Table stops updating | Refresh failures leave the previous rows in place with an error message. Check the Webserver log. |
| No RCA column | No enabled Integrator has correlationEnabled set to true. See Integrator, correlation engine. |