Container monitoring (Kubernetes & Docker)
A URL monitor tells you an application is slow. A workload monitor tells you why: the Deployment is running 1 of 3 replicas, a pod is in CrashLoopBackOff, the container was OOM-killed ten minutes ago. Mugnsoft reads this straight from the Kubernetes apiserver or the Docker Engine API, from a probe, with nothing installed in the cluster.
How it is modelled
Container monitoring follows the same device with children pattern as SNMP and WMI devices.
| Object | What it is | Holds |
|---|---|---|
| Container host | One Kubernetes cluster or one Docker host | Runtime, endpoint, credentials, TLS, discovery scope, probes, schedule, tags |
| Workload | One monitor per workload you adopt | Inherits the connection, tags and schedule of its host; one copy per selected probe |
A workload is identified by what survives a deployment, never by a pod name or a container ID:
| Runtime | Identity | Example |
|---|---|---|
| Kubernetes | <namespace>/<kind>/<name> for Deployments, StatefulSets, DaemonSets and CronJobs |
prod/deployment/checkout-api |
| Docker, compose | <project>/<service>, from the com.docker.compose.* labels |
shop/web |
| Docker, standalone | the container name | web-demo |
compose up. A monitor keyed on one would reset its timeline and SLA at exactly the moment you need the history. Keyed on the workload, a rollout is just a few seconds of reduced readiness on a continuous series.
Before you start
Kubernetes: a read-only ServiceAccount
The probe only ever calls get and list. A ClusterRole, rather than a namespaced Role, lets you leave Namespace empty and see every namespace.
apiVersion: v1
kind: Namespace
metadata: { name: mugnsoft }
---
apiVersion: v1
kind: ServiceAccount
metadata: { name: mugnsoft-probe, namespace: mugnsoft }
---
apiVersion: rbac.authorization.k8s.io/v1
kind: ClusterRole
metadata: { name: mugnsoft-probe }
rules:
  - apiGroups: [""]
    resources: ["pods", "nodes", "namespaces", "events"]
    verbs: ["get", "list"]
  - apiGroups: ["apps"]
    resources: ["deployments", "statefulsets", "daemonsets"]
    verbs: ["get", "list"]
  - apiGroups: ["batch"]
    resources: ["cronjobs", "jobs"]
    verbs: ["get", "list"]
  - apiGroups: ["metrics.k8s.io"]
    resources: ["pods", "nodes"]
    verbs: ["get", "list"]
---
apiVersion: rbac.authorization.k8s.io/v1
kind: ClusterRoleBinding
metadata: { name: mugnsoft-probe }
roleRef: { apiGroup: rbac.authorization.k8s.io, kind: ClusterRole, name: mugnsoft-probe }
subjects:
  - { kind: ServiceAccount, name: mugnsoft-probe, namespace: mugnsoft }
---
# Long-lived token. Since Kubernetes 1.24 a ServiceAccount no longer gets one automatically.
apiVersion: v1
kind: Secret
metadata:
  name: mugnsoft-probe-token
  namespace: mugnsoft
  annotations:
    kubernetes.io/service-account.name: mugnsoft-probe
type: kubernetes.io/service-account-token
Apply it, then read back the three values the form needs:
kubectl apply -f mugnsoft-probe.yaml

# Endpoint
kubectl config view --minify -o jsonpath='{.clusters[0].cluster.server}'; echo
# Token (one line, no "Bearer " prefix)
kubectl -n mugnsoft get secret mugnsoft-probe-token -o jsonpath='{.data.token}' | base64 -d; echo
# CA certificate (PEM)
kubectl -n mugnsoft get secret mugnsoft-probe-token -o jsonpath='{.data.ca\.crt}' | base64 -d
kubectl create token. A probe polling from outside the cluster cannot renew an expiring TokenRequest token, so the monitor would die when it expires. Many managed providers also silently cap the duration you ask for. Treat the token as a credential.
Docker: socket or TLS endpoint
| Probe placement | Connection |
|---|---|
| Linux probe on the Docker host | Leave Endpoint empty: the probe uses the local socket /var/run/docker.sock |
| Any probe, remote host | https://dockerhost:2376 with the CA, client certificate and key from the daemon’s TLS setup |
tcp:// follows the Docker convention: it means TLS when a CA or client certificate is set or the port is 2376, plain HTTP otherwise. Use an unencrypted port only on a trusted private network. It is unauthenticated root access to the host.
Or run the probe inside the cluster
A probe installed in the cluster with the Helm chart needs none of the above: it uses its own ServiceAccount, with the read-only role the chart creates. Set Auth mode to inCluster and leave Endpoint empty. See Install a probe on Kubernetes.
Adding a container host
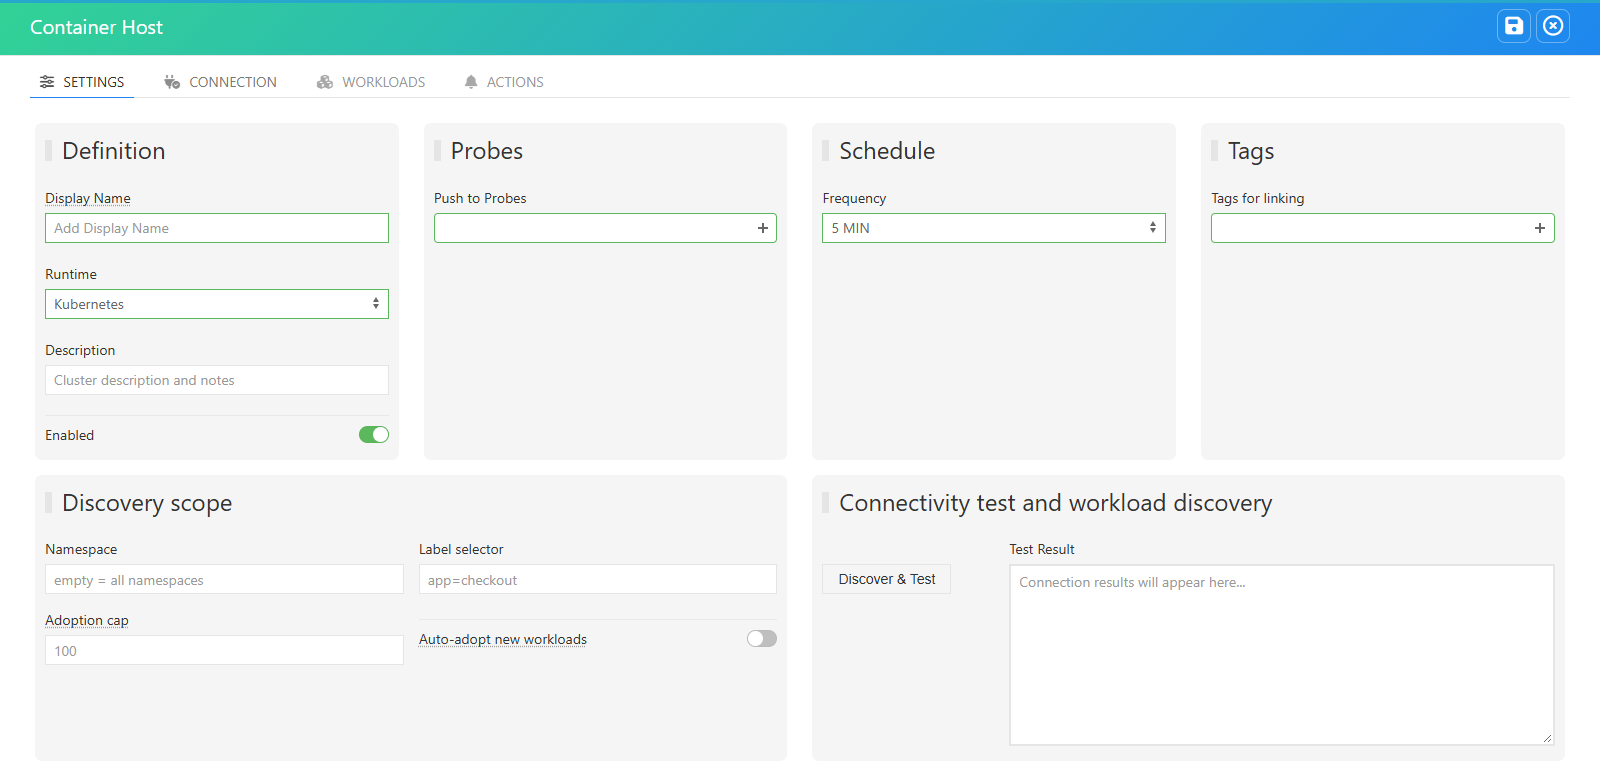
Open Container hosts and click Add. The form has four tabs.
Settings
| Field | Value | Notes |
|---|---|---|
| Display Name | prod-cluster |
Names the host in the UI, reports and events |
| Runtime | Kubernetes or Docker |
Switches the engine and the visible fields |
| Enabled | on | |
| Push to Probes | one or more probes | Only enabled monitor components are offered. Reachability is tested from the probe |
| Frequency | 5 MIN |
1 MIN while you set it up |
| Tags for linking | shop |
Drives application membership and report scope, inherited by every workload |
| Namespace | empty = all namespaces | Kubernetes only. Empty requires the ClusterRole |
| Label selector | app=checkout |
Narrows discovery |
| Adoption cap | 100 |
Ceiling on how many workloads the drift reconciler may propose |
| Auto-adopt | off | See Discovery, adoption and drift |
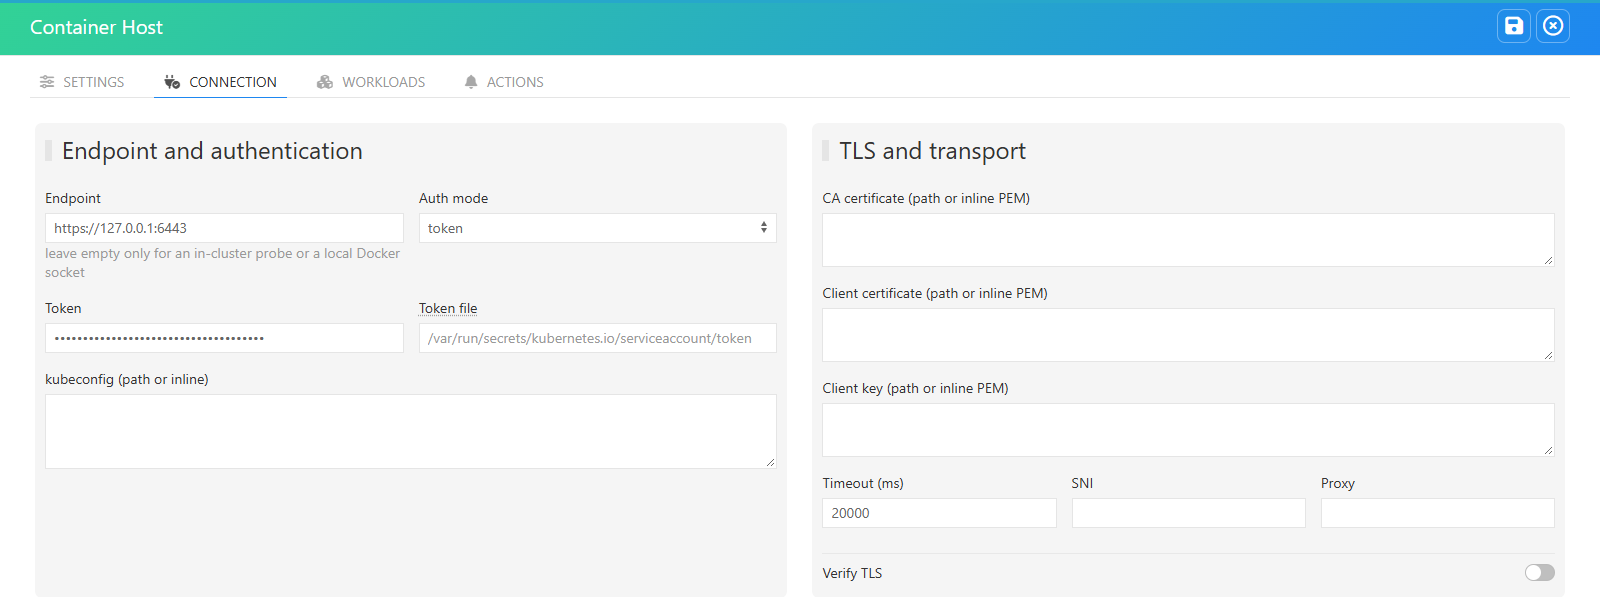
Connection
| Field | Notes |
|---|---|
| Endpoint | https://<apiserver>:6443, https://dockerhost:2376, or empty for a local Docker socket / in-cluster probe |
| Auth mode | see the table below |
| Token / Token file / kubeconfig | depending on the auth mode |
| Docker API version / socket path | Docker only; blank gives v1.43 and /var/run/docker.sock |
| CA certificate, client certificate, client key | inline PEM or a path on the probe |
| Timeout (ms) | default 20000 |
| SNI, Proxy | optional; a proxy never applies to a local socket |
| Verify TLS | keep it on whenever you have the CA |
| Auth mode | Use it for |
|---|---|
token |
A ServiceAccount token pasted inline — the usual choice for an external probe |
tokenFile |
A token file on the probe host. Re-read on every check, so a rotated token is picked up |
clientCert |
Client certificate and key (Kubernetes or Docker TLS) |
kubeconfig |
A kubeconfig path or inline content whose user carries a token, a token file or a client certificate |
inCluster |
A probe running inside the cluster: the mounted ServiceAccount token, CA and namespace are used |
none |
A local Docker socket, or an unauthenticated Docker tcp:// port |
-----BEGIN or a line break is read as inline PEM; anything else is a file path on the probe host, not on the Webserver. Paste the CA inline unless the file really exists on the probe. Relative paths inside a kubeconfig resolve against the kubeconfig’s own folder, as they do for kubectl.
Workloads
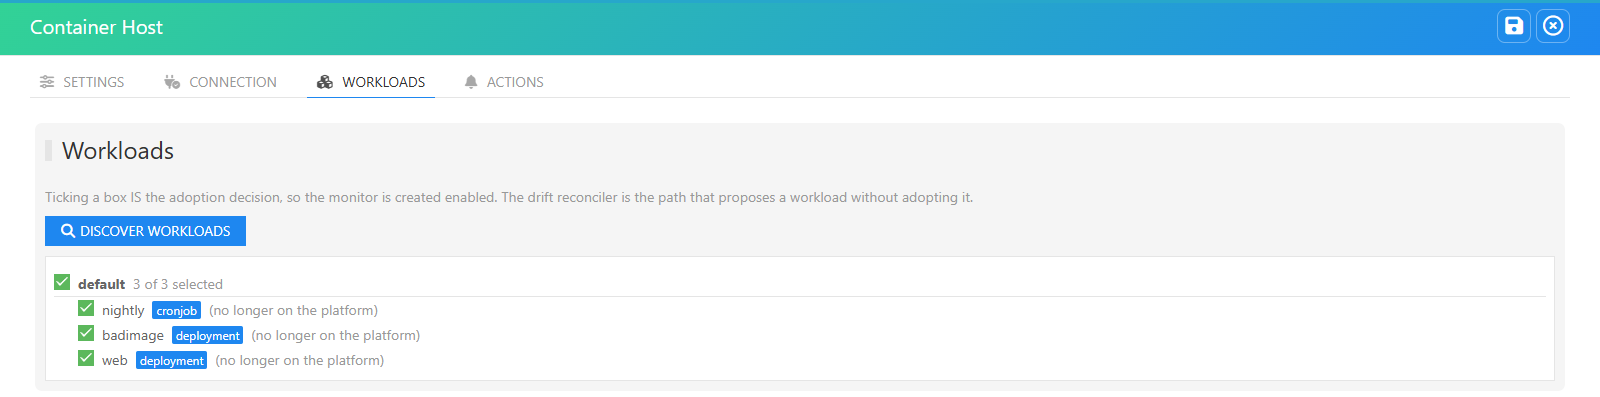
Click Discover & Test (on the Settings or Workloads tab). It posts the form as typed, not the saved record, so it doubles as the connection test:
OK via probe probe-01
4 workload(s) visible

  default/deployment/web            2/2 ready
  kube-system/deployment/coredns    2/2 ready
  kube-system/daemonset/kube-proxy  3/3 ready
  default/statefulset/pg            1/1 ready
An ERROR line names the reason: unreachable endpoint, rejected token, missing RBAC, unknown CA. An empty list under OK means the scope matched nothing.
The list is grouped by namespace or compose project, with standalone containers last; a group’s checkbox ticks every workload in it.
Ticking a workload is the adoption decision: its monitor is created enabled on every selected probe when you save.
Actions
The same notification settings as an SNMP device, applied to every workload of the host:
| Block | Fields |
|---|---|
| Notification settings | Email recipients, Slack channel and token, Teams webhook, PagerDuty API key, custom script and its timeout |
| Notify after | if worse or equal to a status, and after x checks, for x checks (0 = unlimited), and a switch per channel |
| Notify on status change | A switch per channel |
Saving the host pushes these settings to all its workloads, so one change reaches every workload monitor. Without an Integrator the probe sends the notifications itself; with one, the Integrator does. Email needs the SMTP setting to be validated first.
Discovery, adoption and drift
- What is offered. Kubernetes: Deployments, StatefulSets, DaemonSets and CronJobs. Jobs are not offered, because CronJobs create and delete them all the time; the CronJob itself is. Docker: containers and compose services.
docker compose runone-off containers are ignored. - Auto-adopt. Every 10 minutes the Webserver re-discovers each host that has Auto-adopt on:
- a new workload is proposed, never adopted: its monitor is created disabled, up to the adoption cap;
- a workload that vanished is flagged “gone” and its monitor disabled. It is never deleted, its history stays queryable, and it keeps your adoption decision if it comes back.
- Partial answers never retire anything. If discovery was cut short (a kind the token may not list, a timeout, a very large cluster), nothing is marked gone.
- Deleting a container host keeps its workload monitors and their history. Retiring them is an explicit action on each monitor.
How a workload is graded
The severity ladder
ERROR ranks above CRITICAL, and that is deliberate: “I could not look” must never read as “I looked and it is fine”, and must stay distinct from “I looked and it is bad”.
| Status | Raised when |
|---|---|
| ERROR | The API cannot be reached, refuses the credentials, lacks the permission, or the workload no longer exists |
| CRITICAL | Zero replicas ready, or a hard fault: CrashLoopBackOff, ImagePullBackOff, an OOM kill since the previous check, eviction, unschedulable pods, a failing healthcheck, a container configuration error, an exited container, a failed CronJob or Job run |
| MAJOR | Scaled to zero (unless zero replicas is allowed), a rollout past its progress deadline, replicas that cannot be created |
| MINOR | Some replicas not ready |
| OK | Every replica ready and no fault |
The rules
| Rule | Behaviour |
|---|---|
| Readiness | Ready replicas against desired. By default any shortfall is MINOR and zero ready is CRITICAL. Terminating pods are ignored, so a rolling update does not flap |
| CronJob and Job | Graded on the latest run, never on replicas: nothing active between runs is OK, a failed run is CRITICAL |
| Hard faults | Each is on by default. A past termination only counts if it happened since the previous check, so an OOM kill from last week does not keep the workload red. On Docker, a restart clears the container’s state, so OOM kills and crashes since the previous check are also read from the daemon’s events log: three failing exits in that window count as a crash loop |
| Restart delta | Restarts since the previous check. Graded only when thresholds are set; the first check has no baseline and stays quiet |
| CPU / memory % of limit, CPU throttling % | Graded only when thresholds are set, and only when every container has a limit |
Metrics
Every check records seven groups, charted one panel per group in the workload report. Every key is written on every check, set to zero where the runtime has no equivalent, so a Docker container still reports the pod-phase counters as 0 rather than leaving holes in the series.
| Group | Metrics |
|---|---|
| A Availability | Desired, ready, available and unavailable replicas, running containers, uptime (longest-running replica) |
| R Restarts & faults | Restart count and delta, OOM kills, crash-looping pods, image-pull errors, last exit code |
| C CPU | Millicores, % of limit, % of request, throttled %, throttled seconds |
| M Memory | Bytes, % of limit, % of request, working set, RSS, cache |
| N Network & IO | Received and sent bytes, block read and write |
| P Pod phases (Kubernetes) | Running, pending, failed, succeeded, evicted, not ready |
| E Check errors | API errors, timeouts, authentication failures, metrics unavailable, probe failures |
The response time charted for a workload is the API latency of the check, not the application’s latency.
Where the results show up
| Place | What you get |
|---|---|
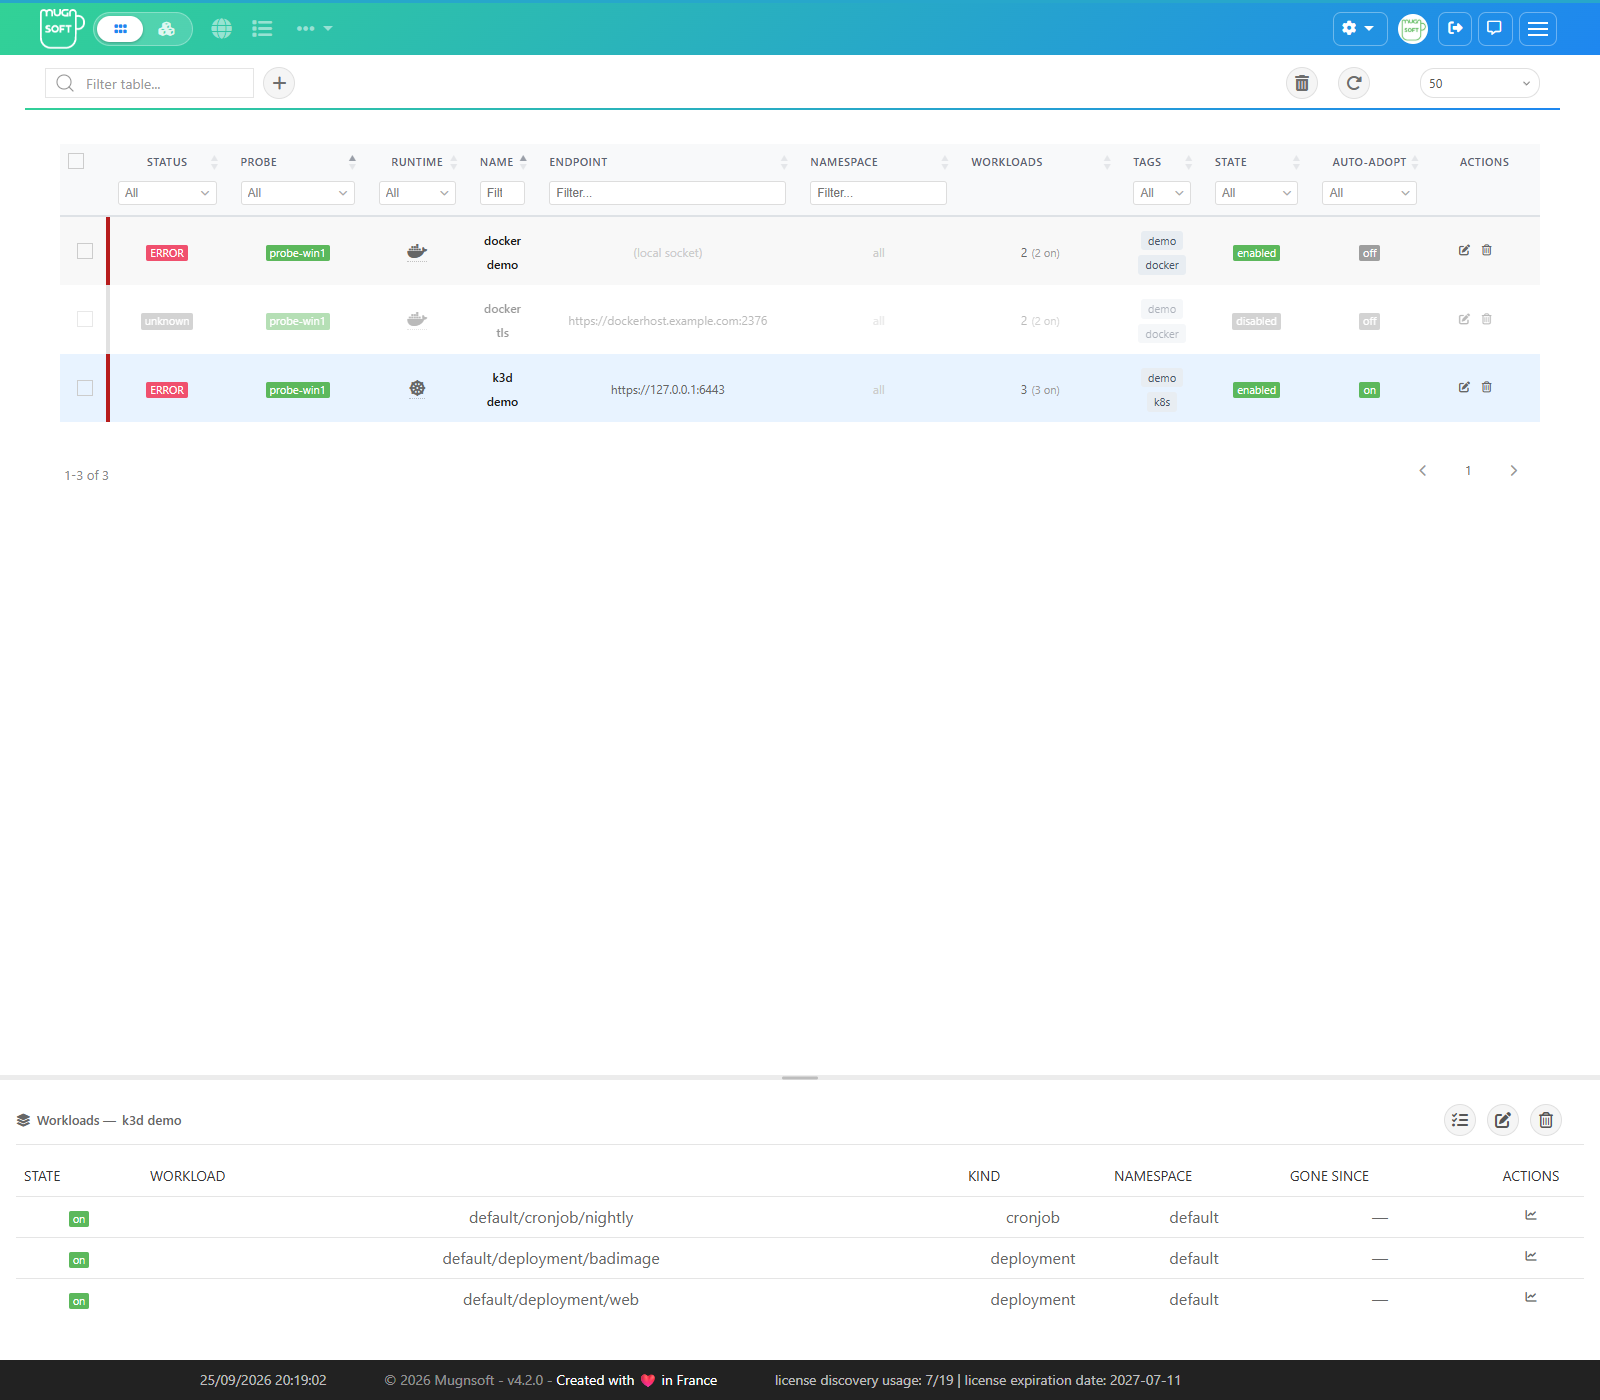
| Container hosts page | One row per host with a roll-up status. The detail panel lists the workloads (on / proposed / gone) with a report button for each |
| All monitors page | Every workload monitor, with the usual filters, report and actions |
| Workload report | Status timeline, status distribution, API response time and the seven metric panels; available as a scheduled report too |
| Applications | Workloads join applications through their tags; the weighted business rule has a Container host weight |
| Notifications | Email, Slack, Teams, PagerDuty and custom script, set once on the host’s Actions tab |
| Integrator | Every workload result: time-series and log outputs, ServiceNow / GLPI / Jira tickets on status change, root-cause correlation |
| Webserver-front | The container host device and its status are replicated |
The container host’s own status combines four independent signals, because they fail independently: the endpoint is reachable, the API answers healthily (/readyz or /_ping), the worst node condition (Kubernetes only), and the worst workload. An expired token therefore reads as an API problem rather than as the cluster being down. On nodes, memory, disk or PID pressure is MINOR, a NotReady node MAJOR, no ready node at all CRITICAL, and a cordoned node never raises severity, so draining for maintenance does not page anyone.
Limitations
| Limitation | What to do |
|---|---|
| Per-workload thresholds are not editable in the UI. Readiness and fault rules run on their defaults; restart, CPU, memory and throttling ladders stay unset | Rely on the defaults. Values set on a workload through the probe API are kept when the host is saved again |
| Node health never alerts. It colours the container host, but no alert is raised for a NotReady or pressured node | Monitor the nodes as hosts with Ping, System or the Sentinel Agent |
| The container host status is not sent to the Integrator, as for SNMP and WMI devices | Nothing is lost: an unreachable API turns every workload ERROR, and each of those is sent |
| No local Docker socket on Windows probes | Use a tcp:// / https:// endpoint, or a Linux probe |
| Managed-cluster kubeconfigs (EKS, GKE, AKS) authenticate with exec or auth-provider plugins the probe cannot run, and are refused with an explicit error | Use a ServiceAccount token. A kubeconfig’s insecure-skip-tls-verify is ignored too: the Verify TLS switch decides |
| No metrics-server: the CPU and memory panels stay at zero, with metrics unavailable set | Install metrics-server (managed clusters and k3d ship it, kind does not) |
| Jobs cannot be adopted | Adopt the CronJob that creates them |
| Discovery is bounded: one Discover & Test lists at most 500 workloads | Narrow it with a namespace or a label selector |
| Not a metrics store. One sample per check at the monitor’s interval, kept for the usual retention | Keep Prometheus or your observability stack for high-cardinality history |
| Workloads are not imported on their own | Import or export the container host: its line carries the workload selection and recreates the workload monitors |
| Version skew. Probe, Webserver and Integrator must all carry the container types | Upgrade them together: an older Integrator rejects workload results, and an older probe has no workload engine |
Troubleshooting
| Symptom | Likely cause |
|---|---|
ERROR on Discover & Test, connection refused or timeout |
The endpoint is not reachable from the probe — firewall, apiserver source-CIDR allow-list, proxy |
ERROR, 401 / authentication |
Wrong or expired token, or the Bearer prefix was pasted with it |
ERROR, 403 / forbidden |
The ServiceAccount is missing a permission from the ClusterRole above |
ERROR, certificate |
CA missing or a file path that does not exist on the probe — paste it inline |
The list is empty under OK |
Namespace or label selector matches nothing, or a namespaced Role with an empty Namespace |
| CPU and memory stay at 0 | No metrics-server, or no limits set — percentages need a limit on every container |
| A CronJob reads OK while its jobs fail | Its failed run has not exhausted its retries yet; it turns CRITICAL once the Job is marked Failed |
| A Docker workload says restart and OOM events unavailable | The daemon refused its /events log — typically a socket proxy that blocks it. The check still grades what the container’s state shows, but misses OOM kills and crashes a restart has already hidden |
See also
- Monitor types — the catalogue of every type
- Monitor Component Deep Dive — storage, engine and endpoints
- Integrator — outputs, ITSM and the causal model, including
workload - SNMP & WMI evaluation — the other device-with-children types
- How thresholds work — severity model and status computation