Testing a monitor
Every monitor form carries a Test button. It runs the check right now, from the probe that will own the monitor, against the real target — and returns a step-by-step verdict without saving anything. Never leave a monitor scheduled that you have not tested once.
What Test does
Clicking Test takes the values currently in the form — not the saved ones — and asks the selected probe to execute the check exactly as the scheduled run would: same request, same credentials, same proxy, same timeout, same thresholds, same pattern groups.
What it does not do:
- it writes no history — the run does not appear in charts or reports;
- it changes no status — the monitor tile is untouched;
- it sends no alert — nobody is paged by a test;
- it saves nothing — closing the form discards both the values and the result.
This makes Test safe to hammer while you tune a regexp or a threshold.
Which types support it
| Type | Test button | What the test does |
|---|---|---|
| URL | ✅ | Issues the HTTP request, checks status, page size and every pattern group |
| API | ✅ | Issues the request with your method, headers and body, then checks every pattern group |
| Database | ✅ | Connects, runs the query, previews the result set and grades every column check |
| TCP / UDP | ✅ | Dials host:port with your timeout, reports connect time |
| Ping | ✅ | Sends the configured packet count, reports latency, jitter and drop rate |
| DNS | ✅ | Resolves the name, reports lookup time and the resolved addresses |
| SNMP / WMI | ✅ | Per-row test, plus a ⚡ Test all in the panel header — see SNMP & WMI evaluation |
| EUM / Web UI | — | Use Run in browser mode instead, which shows the journey executing live |
| System | — | Reads the probe host, nothing to target |
Test is available on the Add form, on the Details (edit) form, and read-only on the View form.
Choosing the probe
The test needs to know which probe to run on:
- on an Add form, it uses the first probe of the Push to Probes selection;
- on View / Details, it uses the probe the monitor is already assigned to.
If no probe is selected the test refuses to run and says so. Select one first.
Reading the result panel
The panel opens under the target field. It has three parts, top to bottom.
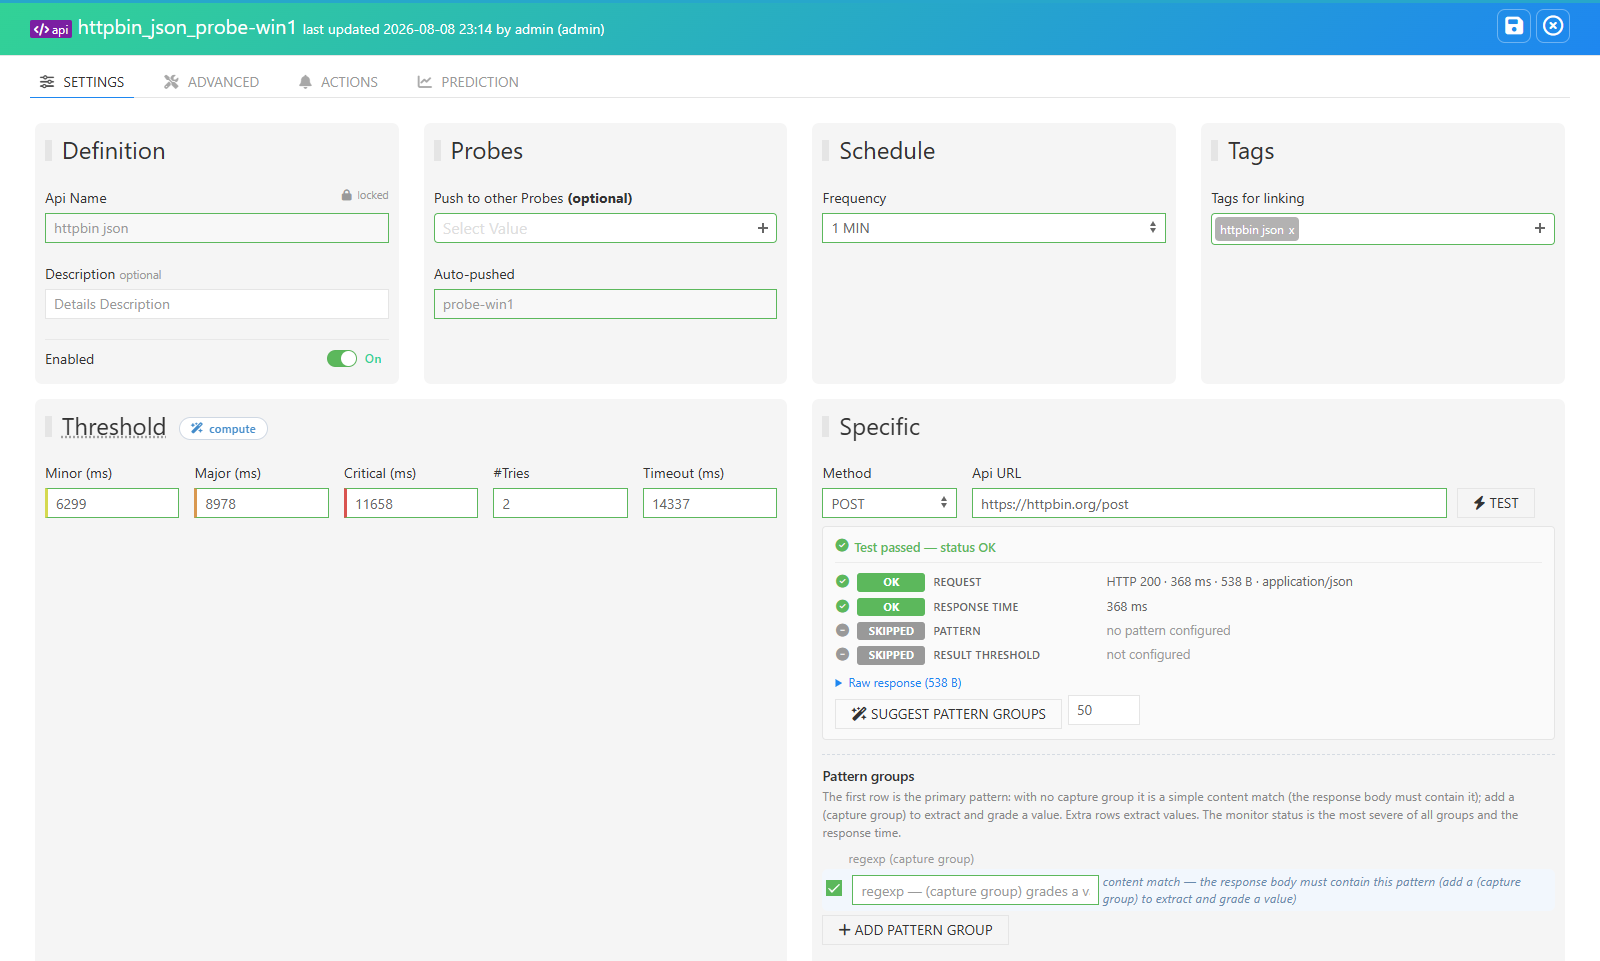
1. The overall banner
One line with the worst status found across every check performed:
✅ Test passed — status OK | ⚠ Test result: MAJOR
2. One row per check
Every check performed gets its own row, with a severity chip, a label and its detail. Which rows appear depends on the type:
| Row | Appears for | Shows |
|---|---|---|
| Request | URL, API | HTTP 200 · 143 ms · 12.4 KB · application/json, or the connection error |
| Check | TCP, UDP, Ping, DNS | The one-line summary — connect time, replies and average latency, resolved name |
| Response time | all | The measured time graded against the form’s Minor / Major / Critical, with the thresholds recalled when breached |
| Result set | Database | 142 rows × 6 columns, with an expandable preview grid |
| Page size | URL | The body size against the configured page-size rule, or not configured |
Pattern: <name> |
URL, API, Database | One row per pattern group or column check: what it captured and how that graded |
| Result threshold | URL, API, Database | The aggregate — the most severe of all groups |
3. The raw response
An expandable Raw response section holds exactly what came back, with its size and a truncated marker if the body was too large to return in full. JSON is pretty-printed and syntax-highlighted, so you can read the payload and pick the field you want to grade.
Ping and DNS put their detail here too — best/worst/avg, jitter and drop rate for Ping; the resolved addresses for DNS. Database monitors show the engine-side timings (lock time, CPU/worker time) here.
Severity chips
| Chip | Meaning |
|---|---|
| OK | The check passed |
| SKIPPED | Not configured, or the group is disabled — it does not contribute to the result |
| MINOR / MAJOR / CRITICAL | A threshold was crossed. This is a verdict about the target, computed correctly |
| ERROR | The check itself could not be evaluated — bad regexp, unresolvable column, unreachable target |
URL & API: from a test to pattern groups
The fastest way to build content checks is to let the endpoint fill them in:
- Fill in the URL (and, for an API, the method, headers and body).
- Click Test. The raw response comes back.
- Click Suggest pattern groups. Mugnsoft inspects the actual response — JSON objects and arrays, plain-text
key: valuepairs,<tag>value</tag>markup — and proposes a name, regexp, match index and operator for every value it found, previewing what each one would capture. - Untick what you do not need, edit names, then Apply selected. The groups land in the grid with blank thresholds for you to fill.
- Click Test again to confirm every group now captures and grades what you expect.
A max suggestions box next to the button caps how many are proposed (default 50, up to 200).
Database: the result-set preview
A database test does more than time the query. It returns a capped preview of what the query produced — up to 20 rows and 64 columns, with each cell truncated to 512 characters — and that preview does two jobs:
- You see the shape of your data before writing a single check: column names, types, and the first rows.
- The column names become autocomplete suggestions in every column cell of the Column checks grid, alongside the
#rowsselector.
The preview exists only inside the test response. It is never stored, never charted, and never leaves the form.
The recommended loop is therefore:
- Enter the connection details and the query, click Test, read the result set.
- Add a column check, pick the column from the autocomplete, choose the operator.
- Click Test again — each check now appears as its own row with the value it captured and how it graded.
- Adjust the thresholds until the verdict matches what you consider healthy, then save.
A check that reports ERROR — column 'loaded_at' not in result set, or column 'id' is ambiguous, appears more than once — select it by position (#2 or #5) — is telling you to fix the check. A check that reports CRITICAL — query returned no rows, value is NULL — is telling you about your data.
When a test fails
| Symptom | Likely cause |
|---|---|
| unreachable — … | The probe cannot reach the target: firewall, DNS, proxy, or the service is genuinely down |
| Select a probe first to run the test | No probe chosen on the form |
| Failed — could not reach probe … to run the test | The probe is offline or unreachable from the Webserver — see communication issues |
| HTTP 401 / 403 in the Request row | Credentials, header or client certificate wrong |
| no match found in the response on a value group | The regexp does not match this body — read the raw response and re-derive it, or use Suggest pattern groups |
| content not found in the response on a content match | The body genuinely does not contain the text — that is the check working |
| ERROR on a pattern group | The regexp does not compile, or captures nothing usable |
| failed to execute the query | Connection refused, bad credentials, SQL error, or the timeout was too short |
| A one-line plain-text result instead of the panel | The probe predates the structured test report — update the probe to get the full panel |
Habits worth keeping
- Test before every save, on creation and on every edit. A monitor that was correct last month is not necessarily correct after the endpoint changed.
- Test after changing the probe. Reachability is a property of the probe, not of the target.
- Test after a threshold change to see the new verdict immediately instead of waiting for the next scheduled run.
- Use the raw response as documentation — it is the fastest way to see what an endpoint actually returns today.
See also
- Monitor types — what each type checks and how it is graded
- Monitor operations — create, run, edit and maintain monitors
- SNMP & WMI evaluation — per-row tests, Test all, suggestions and browsers
- Monitor Configuration — the stored format behind pattern groups and column checks
- Communication issues — when the Webserver cannot reach a probe
- Exception running a monitor — troubleshoot scheduled executions