Infrastructure overview
The overview answers one question in a few seconds: is anything wrong right now? It counts every monitor of every probe, lists the ones that are not OK, and tells you when a probe has stopped answering.
Open it
Click the Mugnsoft logo in the top bar, or open the … menu and choose overview.
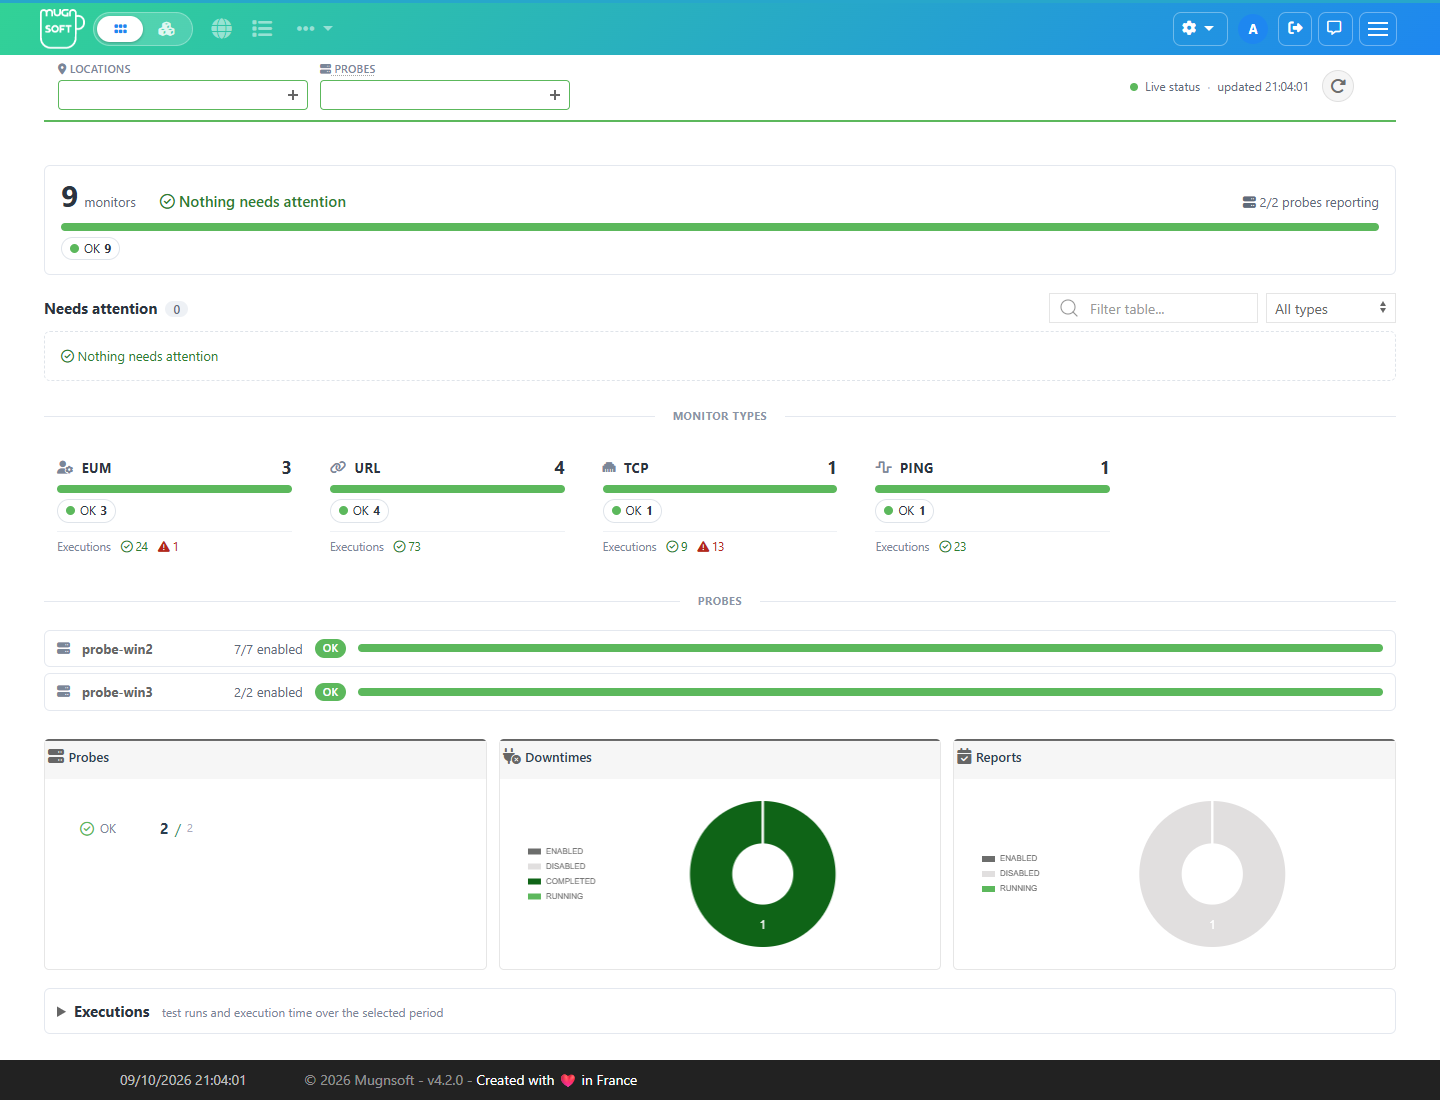
The page shows live statuses, read from the probes, and refreshes by itself every 30 seconds. The time of the last refresh is at the top right, next to the refresh button.
Read it from top to bottom
| Block | What it tells you |
|---|---|
| Locations / Probes filters | Restrict the whole page to some locations or probes. Empty means everything. |
| Summary | The number of monitors, a verdict (Nothing needs attention or N need attention), one chip per status, and how many probes are reporting. |
| Needs attention | One row per enabled monitor that is not OK: status, name, type, probe, location and since when. Filter it by text or by type. |
| Monitor types | One tile per type you use, with its monitor count, its statuses and its successful / failed executions. Click a tile to filter the list above on that type. |
| Probes | One line per probe: enabled monitors, worst status. Click a line for the detail by type. |
| Probes / Downtimes / Reports | How many of each are enabled, running or disabled. |
| Executions | Test runs and execution time over the selected period. Closed by default: click to open. |
Good to know
- A monitor type appears only when at least one probe has monitors of that type.
- Disabled monitors and monitors that have not reported yet are counted apart: they never make the page say that something needs attention.
- From a row of Needs attention you can open the monitor’s report or disable the monitor.
When a probe does not answer
The statuses come from the probes, so a probe that is down cannot report its monitors. The page says so in three places: a red banner at the top, N/M probes reporting in the summary, and No data received from this probe on the probe’s line.
Until the probe is back, its monitors are missing from the counts. Check it on the Components page: see Components operations.
Where to go next
| You want to | Go to |
|---|---|
| See every monitor, with its last value | Monitor operations |
| See what changed and when, with the probable cause | Events page |
| See the health of a business service | Reading the application report |
| Understand a status | Monitor statuses |